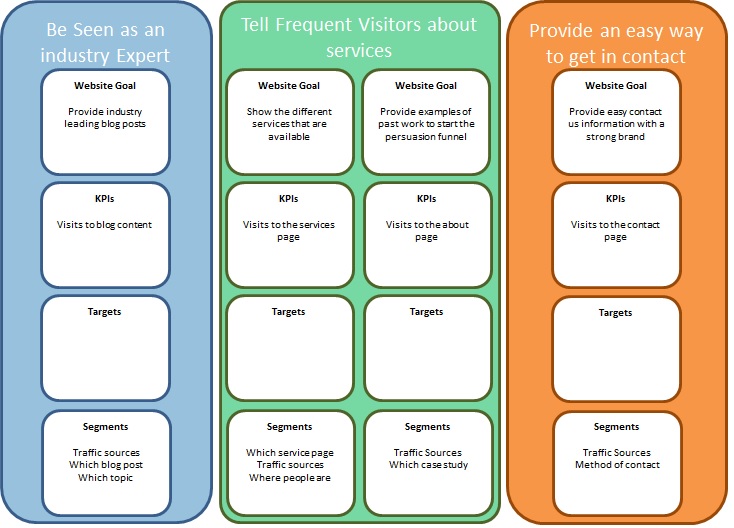
What are ‘segments’ in Measurement Frameworks?
A couple of weeks ago I was privileged to talk at ProductTank in London: a group of product managers who meet monthly to have a few drinks and talk about being a product manager (well worth signing up if you are a product manager!). I was a guest speaker along with Matty Curry at Lovehoney and Peter O’Neill at L3Analytics discussing Web Analytics and how to do it. Predictably I was talking about measurement frameworks in non-retail environments and how to use them to work out KPIs from your business objectives and strategy. An important thing for a product manager who wants to be able to report on the success of their product. We ran through some case studies of mostly nameless companies and how they did this.
To my surprise one of the big questions that I got subsequently was “What do you mean by segments and how do I work them out?” Since then I’ve had several other conversations about this. My explanation of segments is always:
A segment is anything you can change that will effect your KPIs
Of course the classic example for many companies is your paid search campaigns – you can change them, so you want to look at how each one does individually. However maybe what we need to do is go back a level first.
Dimensions
A dimension is a measurable quantity that has a series of distinct values. Dimensions can be related to the person themselves (eg what is their age, or their sex), a particular visit (where did they come from to get to the site, what day of the week is it, have they visited before) or a particular page (what is the url or title of the page, what category does the product on the page belong to, what was the previous page). These dimensions are effectively the heart of your reports. When you look at a report for something you will have a column that says give me the values for this dimension, with subsequent columns being for the measures associated with it (whether that is ‘impressions’, visits, conversions, revenue, visitors, etc). The thing with dimensions is that they tend to be quite custom depending on what it is that you are doing. Sure some things are common and you will find them in analytics tools:
- Traffic sources (either as a domain name, or grouped together into types like ‘organic’)
- Search terms (this is a bit of a cheat though, because it comes from the same thing as above)
- Page urls (or page titles, or page names or all of the above)
- Browsers, operating systems, location, etc (all of these come from information sent by the browser with its request for the page)
- New or repeat visits (based on whether the user has a cookie or not, usually)

But for you and your website there are going to be different things that you might want to capture. In the example of my website, I tag each article with a series of categories so that users can find all posts on a certain subject. I might want to know what sort of articles people are looking at, so I might use as my dimension the category of the article. This tends to be relatively common across many publishing sites. However on another project I’ve been working on recently, one of the things we do is get people to login and suddenly information that the users give us about themselves is a useful dimension. Note that if you do have a registration process (or any form for that matter) make sure you only collect essential data. You should not be collecting data for your dimensions if it s going to have an impact on your conversion rates. And if you do collect non-essential data users are more likely to give it up if you prominently tell them why you are doing it and what you intend to use it for (not in the small print).
Segments
When we talk about segments, what we actually mean is what particular value (or group of values) from a dimension are we most interested in and want to treat as a separate entity. With these as a separate entity, you can then do other things with them – for example view how they behaved in a different dimension. As an example, one of my clients last year had a site that was aimed at driving people off to other websites where they could make a purchase (of sorts). The KPI was how many people clicked off to these 3rd party websites. But it turned out that you could only buy the product if you were in the UK or Ireland, so we created a segment for the UK and Ireland. We then used this segment when doing our analysis and reporting in conjunction with the other dimensions. Matty Curry talked at Product Tank about how he segmented products that were out of stock from his figures. That way he had a figure for conversion rate for in stock products to see what he needed to do to get more purchases from them. And for the out of stock products that people were finding, he could send that to the warehouse team to stock up on. ‘Is the product in stock’ is a dimension and ‘out of stock’ is the segment. When I worked at a publishers, we segmented a certain type of article out into a different group. These articles were syndicated from somewhere else and we wanted to see if they actually had an impact. Sure we could see them in the pages report (and we could tag it as a separate dimension if we wanted) so that we could tell how many of them there were. But the hypothesis we had was that they were difficult to find in Organic search and didn’t encourage users to stay on the site because there were few links. We created a segment for these users and low and behold those things turned out to be true and we could work out our negotiations on that. Ultimately these are things that you as a business will need to work out for how you operate, what you have personnel doing and how much control you have over change in each area.
Creating segments in your analytics system
How do you do this in your analytics system? Well in most systems there is the option of adding a secondary dimension to your existing one, so that you can break down one dimension by another. In this case, you ma need to create ‘fake’ dimensions for groups of another dimension (traffic sources tends to be one of these ‘fake’ dimensions – the system calculates it in the background based on a rule set of what to put where) so that you can get the segments that you need. Or alternatively you can use the inbuilt segmentation creators that exist in most analytics tools today. Google Analytics introduced their’s back in 2008 (I’m still amazed at how old this blog is!) and SiteCatalyst not long after. As always though – working out what it is that you need to measure and how much you control over it is the most important thing to do first.