Google Analytics is dead. Long live GA4.
Spoiler alert! In the Hitchhiker’s Guide to the Galaxy, just before the Earth is destroyed by the Vogon ship, all the dolphins disappear from earth to an alternate dimension. Worried about the earth they dragged it and everything on it into a parallel universe where it wasn’t destroyed by the ship and everyone living on earth could continue in blissful ignorance. That is where Google would like to think Google Analytics is going at the moment (but more of that later). Of course Google are the human’s in this situation – they believe that they are more intelligent than the dolphins (the user’s of the tools) because they built the thing, worked out how it should work and we the user’s just spent our time mucking about. The dolphin’s of course believed they were the intelligent ones precisely for the same reason.
So now that Google’s sunset of the old Google Analytics is over (although mine still seems to be working as of Sunday evening – maybe someone needs to be in the office to hit the ‘off’ switch) we’re now going to live in this new dolphinless GA4 world, albeit one that hasn’t been destroyed by a Google shaped Vogon ship. The analogy is getting tortured now, so let’s talk about what GA4 is and why it is different.
Event Driven reporting
When we first started doing analytics 20 odd years ago with log file analysers everything worked with ‘hits’. Hits were a nonsense of course – the old tools would count the number of elements loaded from a server and then report the number of them – each one of these was a ‘hit’. Because you didn’t care about how many images were loaded, the tools moved to counting just a single hit on the page load.
Then of course we had all sorts of issues with log file analysers that meant we were missing stuff (or in some cases counting irrelevant stuff) and moved to JavaScript tags. This also had the advantage that we could trigger tags at points where it wasn’t a page load – it was content changing on a page that didn’t involve the server, or some of the page loaded or you wanted to know a click on a specific link. In addition to ‘page views’ we were getting ‘events’.
And so for 20 years we lived in a world of page views with a series of parameters that we collected specifically for pages (eg page names or urls) and events where we had a series of parameters that were separate (eg event labels, actions, categories or link name/link type in Adobe).
But GA4 is different.
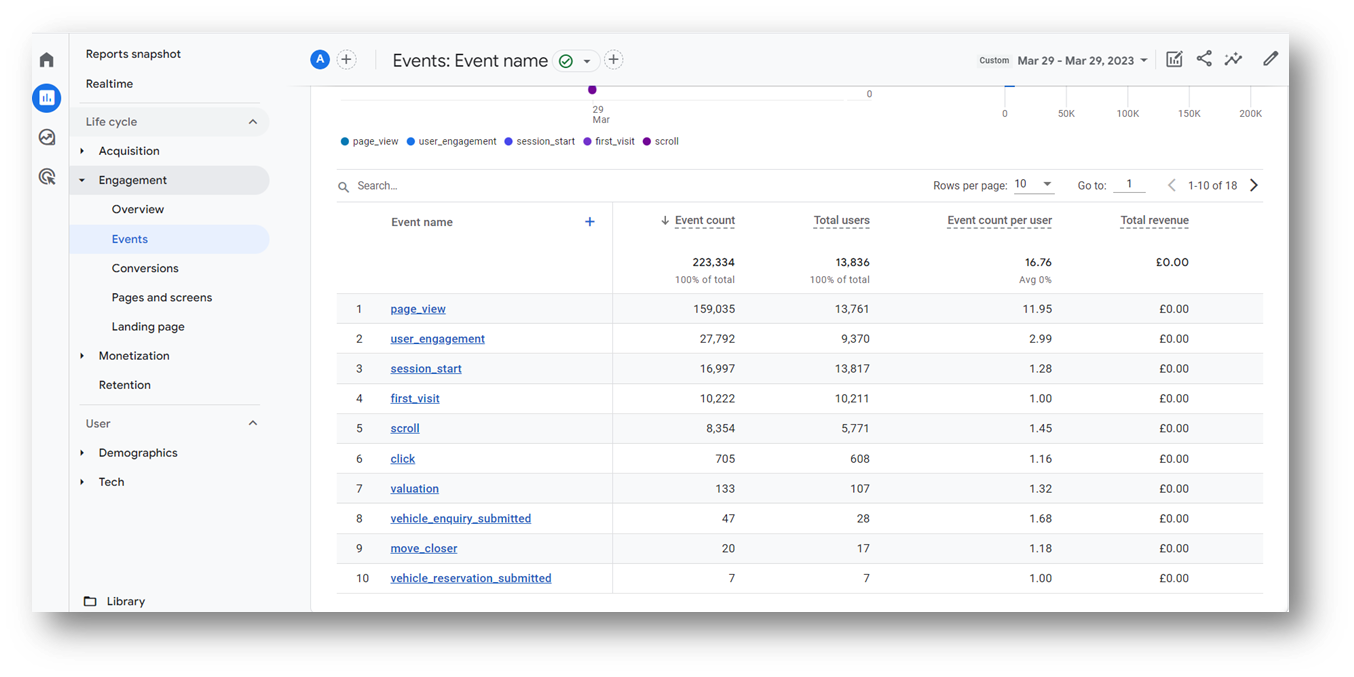
GA4 scraps page views and works entirely in a world of only events (it’s not new – others have been here for a while – eg Snowplow). Everything is an event and page views are just one of those events.
Some events have specific things that will be automatically collected with them or that you can report on, but many will not. This leaves you with a more complicated implementation – is your purchase of a product a page view event, is it a purchase event or is it both? In a single page application what is a page view and what is just a screen change?
Automatic Events
The other thing that GA4 does differently is that it has decided that on page tagging doesn’t work, tag managers are too unreliable and that it is going to put a series of events some of which happen automatically with no choice and others which you can choose to have on or not.
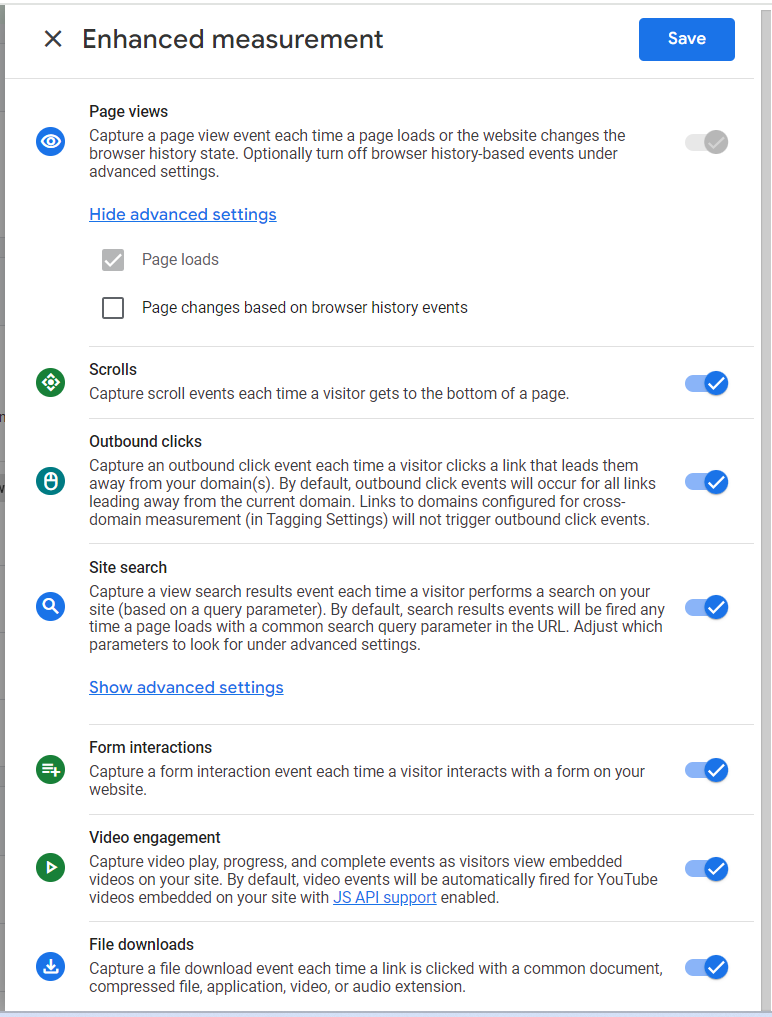
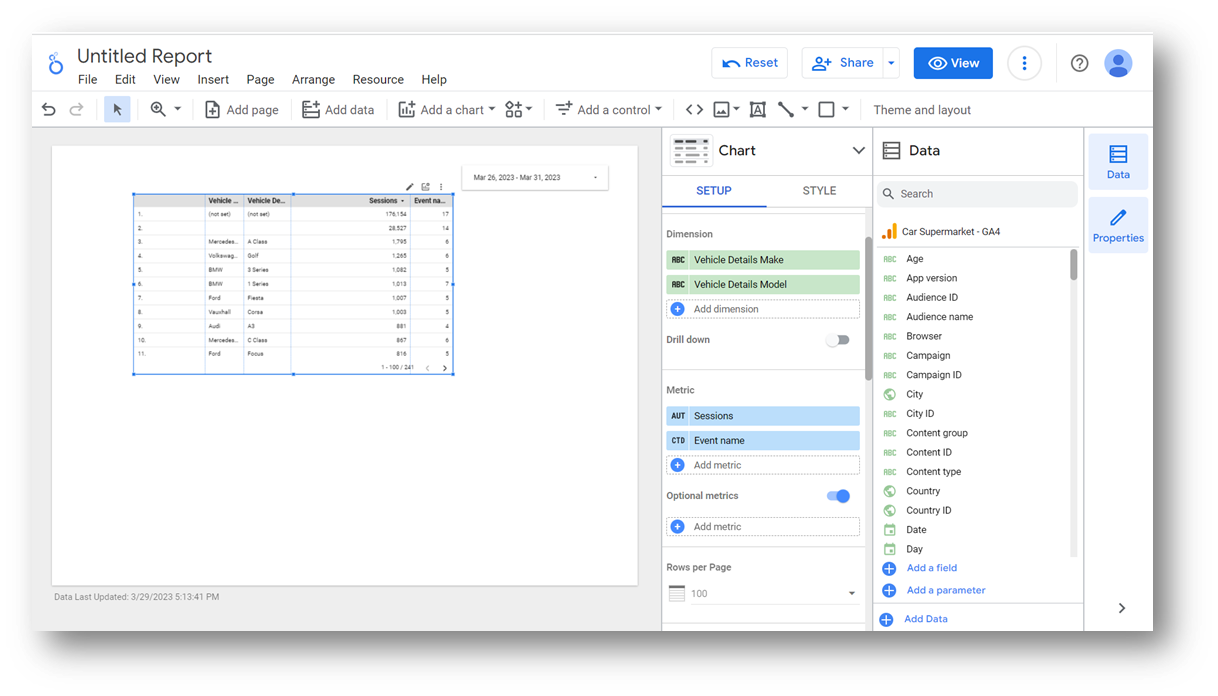
What does that all mean? Well it means that your reports will contain a hit that is triggered called ‘session_start’ the moment the user lands on the page at the beginning of their visit, that the first time they arrive there is a ‘first_visit’ event and that there will be a ‘user_engagement’ when the user does something to stop the session being a bounce. Alongside that there are a series of predefined events that you can include in your data based on your individual stream (see the screenshot above).
Only then, after all these, do you start to think about what you might want to include as custom events in your reports within your tag manager. Don’t forget that page_views are a specific type of event, so you can choose not to fire any page_views if you don’t want to when you load your tags from within the tag manager.
Reporting
Finally onto the bit that you are probably most interested in – how do you report your new data? Well the answer to this appears to be ‘with great difficulty’. I think it is fair to say that we don’t think this bit of GA4 is quite finished yet, which is annoying because we have to use it now the old GA is finished.
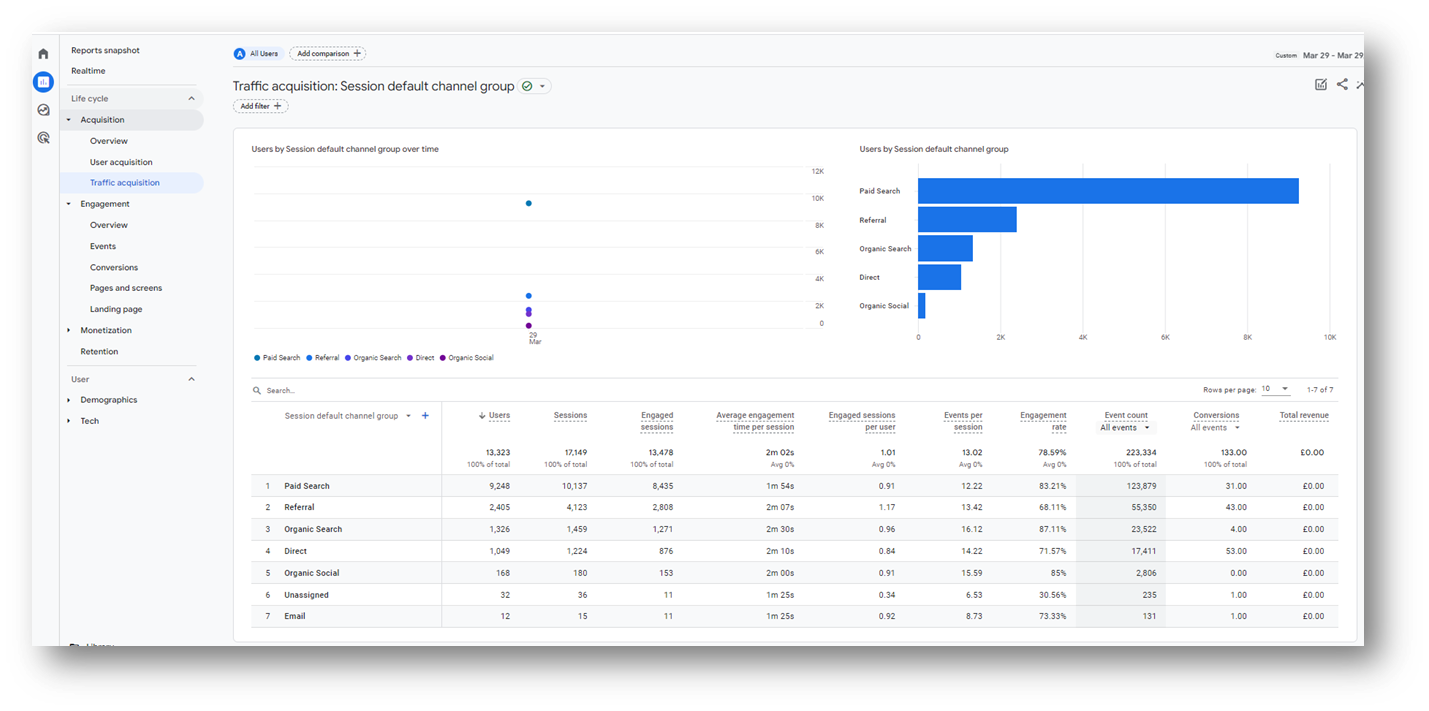
Firstly there are a series of reports that you can create (as well as out of the box ones) that allow you to view the number of events and conversions against specific dimensions, similar to how you used to in the old Google Analytics.
There are limits here – you can’t graph very easily, filters don’t necessarily change graphs and there is a lot of real estate given up to charts that are either useless or just repeating the same data. You can get rid of them, but by default they appear. The reports themselves have prepopulated information, which you can choose to show specific events against or specific conversions. These are counts of events – if you want the number of users of an event against your dimension you can of course go and do it the other way around, but most of this is just a bit of a faff.
Secondly there is the newly built ‘explorer’.
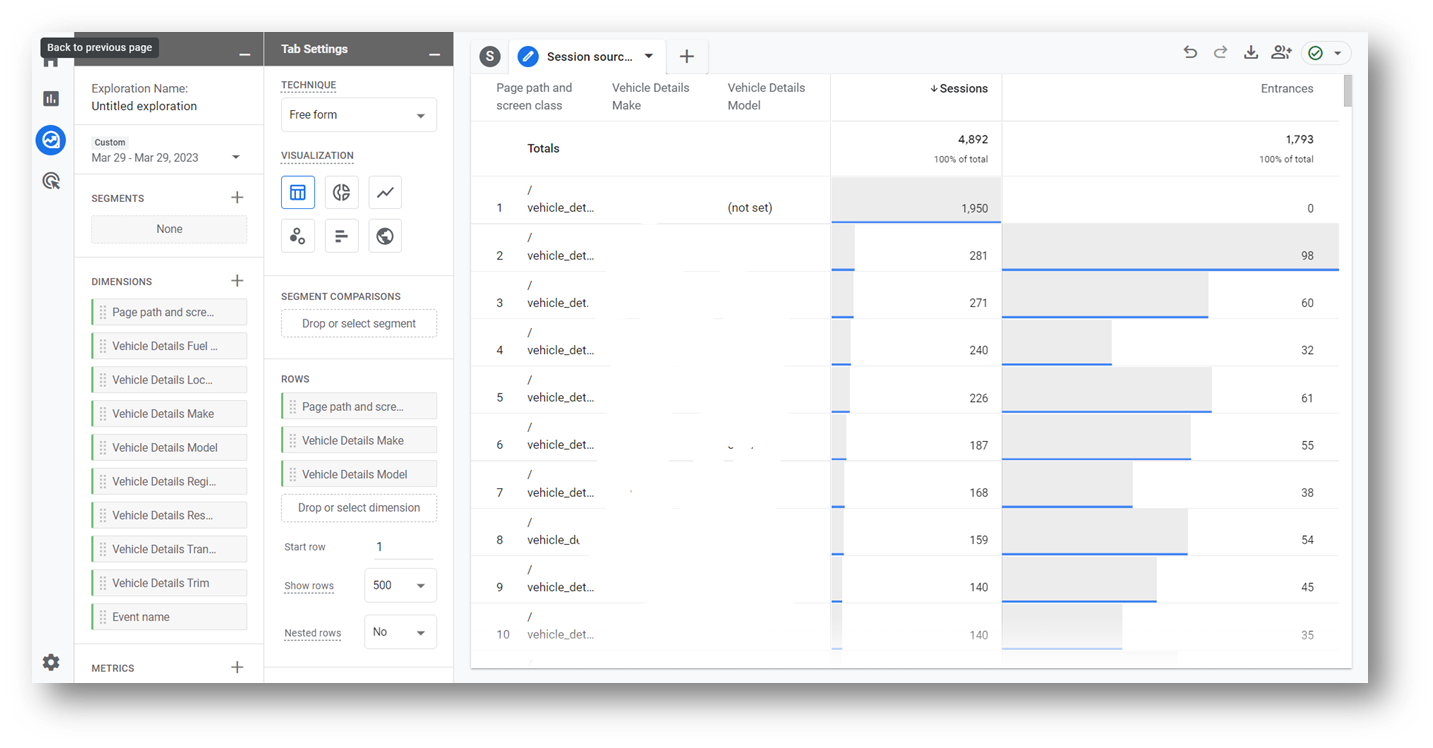
This is far more comprehensive than the previous custom reports that you had in the old google analytics. You can build and implement segments on the fly, add in filters, have multiple dimensions and metrics. But as with the interface, it is all just a bit of a faff – it doesn’t quite work how you want it to. It’s great if you are doing some exploration of why something is happening, but you don’t want to use it as a dashboard that you keep coming back to.
Finally there is the rebranded Data Studio which is now Looker Studio.
Looker Studio is really useful, but it too hasn’t been finished yet. There are dimensions available in GA4 that just aren’t available yet in Looker Studio. They’ll get there at some point, but in the mean time you have to hack away at it and end up with things that aren’t quite what you wanted in the first place.
Reports that are created in the old Google Analytics using segments aren’t possible here. Filters are far stronger than they were in the old Google Analytics but the inability to create a segment that says if someone did X in their visit I want all of the rest of the events severely inhibits it.
If your site is small enough, I’d strongly recommend that you go into the route of putting the data from the site into BigQuery and then doing all your manipulation in there first.
Conclusion
The overall outcome of all this is that you still need the strong basics of an implementation. You need a data layer set up with a strong specification on the things that you want in it. You need to set up with your tag manager the specific events that you want to capture at the right points using events and dimensions as filters. You need to work out what your business questions are and how you want to respond to them. The days of just sticking the default code on the page and hoping you can work it out from there are all gone.