Data Modelling and Statistical Significance in Web Analytics
In the last month or so, I’ve been doing some data modelling so that we can build up some ‘forecasts’ for some of our KPIs for the next year. Particularly of interest for you guys will be what I’ve been doing in forecasting the number of visits and interactions with the site. I’ve also been involved (although in a rather limited way) of some penetration targets and how we are going to achieve them. But that is not so important here. What I thought I’d do is go through some of my though processes on this one and why it proved to be more tricky than you’d imagine.
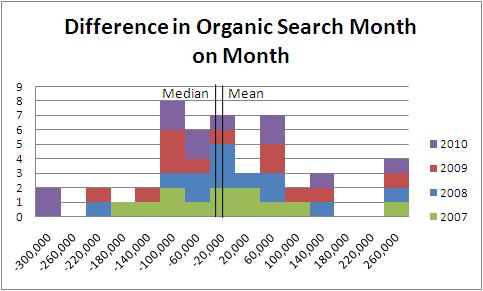
First though, lets go back a bit in time to when I wrote about the difference between accuracy and precision (PS, no analytics vendor has yet given me a figure as to how precise their tool is). Let’s start looking at some real data so that we’ll be able to see what we mean. Below, I have compiled a graph that shows how visits to the site I work on changed month on month throughout the year. I’ve added in a line that shows the median and a line that shows the mean for this as well.

So here we can see what looks like quite a nice distribution. My rather skewy axis doesn’t show you that the mean shows an increase of 14,000 visits a month from organic search, whilst the median shows a 2,500 decrease. The median is skewed slightly in this report becasue there are an above average distribution just below the zero point, whereas the mean is skewed by two very low values (at -300,000) and four very large values (at +300,000).
However there are only 48 data points on this graph, so we end up with quite a large standard deviation of almost 140,000. The standard deviation shows you how far away you are on average from the mean of the distribution.
So has this value been going up at all in the past four years? By the looks of the table above, it looks almost impossible to tell, if anything it looks like it hasn’t. So we would use a statistical hypothesis testing technique. To do this, we would take our mean (14,000) and divide it by the standard deviation (130,000) divided by the square root of the number of values (48). Because the number of values is low and standard deviation is high, a hypothesis that the visits (month on month) have remained the same would yield a z-value of about 0.68. Looking this value up in a table it would mean we’re getting to about 0.50 (double the value in the table given because it is only looking at half of the normal distribution).
This means that if we had a hypothesis that the value hadn’t gone up at all 50% of the time we would be right.
This is not very precise at all. Remember that previous post? Even if we are completely accurate, in a month on month fashion, we can’t tell whether we are moving upwards or downwards at all. In fact, 50% of the time we think we’re not moving at all! This is really not very precise. If you were going to build a model for you KPIs and you said, I think that we are not going to move up or down, but I can only be 50% sure, I would be laughed out of the office!
So instead we decided to rebase the data. Instead of doing month on month variances, we went for year on year (based on each month):
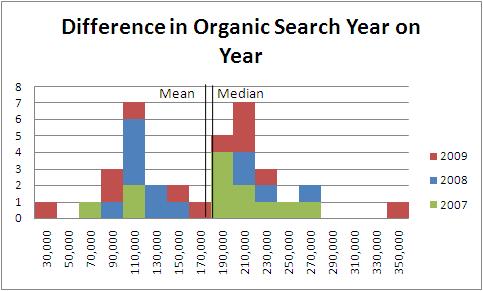
Here we have a much similar looking pattern of distribution, but on a much smaller scale (the data only goes from 30,000 to 350,000). Because of this, our average is 178,000 and our media is 191,000. Now our standard deviation is only 67,000, however we only have 36 data points as opposed to the 48 above.
Doing the same test as before, we would come out with a figure that was much lower than it was before. Month on month we only had a 50% confidence that we were increasing at all. Year on Year that confidence has gone up to almost 100%, because the standard deviation is lower in this range (even though the volume of data points is lower). This would work out to a z-score of almost 16 (so yes well over 99.99% sure that it is going to change – we’re off the radar of the table given).
Normally you would expect to have to increase the volume of data points to be able to get something statistically more likely. Here we have remodelled the data to be able to show that the way to getting good figures is to be more precise. In our case we have lowered the standard deviation of our points to make them more statistically significant.
More traditionally you would use other ways to show that your changes had statistically significant changes:
- Sample size. When it comes to research, this can be one of the better ways of improving. Asking a small sample what they thought of your website, changing it and asking another small sample may yield results that aren’t statistically significant. Be wary though, increasing your sample size does not proportionally increase your preciseness. Remember that formula up there had a square root sign above the sample size, but this can be very important at the lower end of your scale
- Increase your time period. This is usually much easier to do in Analytics. If you don’t have enough data for an accurate model, then increasing your date range should give you more figures. This is effectively increasing your sample size by counting for a longer period. Be wary of the pitfalls though – a small change in your site, campaign, real life could all mean that you are not comparing like with like
- Improve the precision of the tool. For my example we were looking at hundreds of thousands of visits to a website that was changing on a regular basis to an audience that was changing on a regular basis over a four year time period. If you can, you should break this down into smaller time frames where things haven’t changed (as much). This should reduce your likelihood of an outlier, which will much reduce your standard deviation
- Look for cyclical patterns. My cyclical patterns are definitely yearly, however you may discover that you are looking at weekly patterns or even monthly patterns that show how people interact – comparing these changes may allow you to see a better pattern emerge and reduce your standard deviations
If you want some additional reading on this Avinash’s excellent analytics tips from four years ago (!) may be of some use to you. More recently Search Engine Land has got in on the act and I am sure there are a host of others that you know about that you can share in the comments below.
I have a question about the best way to go about a particular statistical analysis, and, considering this post, thought you might be able to head me in the right direction 🙂
I am working with data from Google Analytics. I have the network a visitor came from (e.g., Comcast, Verizon, AOL, etc). Then I have the visit data for those networks and the goal conversion data as well (so three columns total, w/ about 1,200 rows).
My theory is that visitors from certain networks convert better than others. The problem is that I have hundreds of entries where the visits are in the single digits, so calculating the conversion rate isn’t much useful (if it helps, my data is very much a long tail looking distribution).
Any help is greatly appreciated!
Hi Adrian,
I think there are two strands to your question:
Firstly you have a discrete data set that has a lot of data points that makes it seem like it is continuous. It’s a difficult concept to understand when there are words rather than numbers. You’ll find something similar happens with your search terms.
To get around this problem your best bet might be to group your small volume networks into a larger group, thus reducing your workload. From this larger group you can then try and identify those that fall outside a standard pattern by looking at their likelihood to be the mean (or median) by using the statistical hypothesis testing above. For those with only one or two data points you’ll quickly discover they won’t fall outside the confidence level, so you can leave them in the group.
Secondly this action above will lead you to a more useful point. Instead of having to deal with lots of different segments, you have a much reduced volume that you can then treat differently. The question I would then ask is that even if your hypothesis was true, what could you do about it? Presumably the same site shows up for all the networks so there is no way you could change the behaviour. If you can build in any demographic information from the networks then it might help you target your advertising better. Personally I suspect there are bigger wins in other places.
Hope that helps!
Alec