After the last post where I got all Philosophical on you, I’m going back to my roots this week. Partly because I spent half of last week sitting in front of the computer with a bit of writers block. Possibly accentuated by the fact that I had a cold (“Ahhh, Alec” is what you’re meant to say). Plus I’ve had to rewrite this opening paragraph a couple of times every time I started afresh. So what I’ve decided to do this week is talk a little a bit about what we call ‘voice of the customer’. Web Analytics is great at telling you what it is that users do on the site. You can monitor what they search for, what pages they look at, where they came from, etc. If you want to know why they do it though, you have to go to the next step available and ask them.
These two things don’t have to be entirely independent though. In fact, they should feed into each other in a way that is seamless. Let’s start at the beginning and see how you should use your analytics to feed into your surveys (then we’ll do the more important bit of doing it the other way around).
I wrote about this (a bit) when I was talking about the EU cookies law, because someone on Slashdot was commenting that you can get your site design right solely by using this sort of methodology. Really I want to push a bit of a point here. Your Analytics systems should be telling you about places where you have need for improvement. Whether that be because of a high bounce rate, or a high drop off. To fix the problems you have two choices – you can try a continuous improvement process with lots of A/B testing.
Or you can go down a slightly different route and start asking people what they think about the process. There are two ways of doing this – one is to hire some people and sit down with them whilst they do it. This will get you limited sample data. The other method is to put up a survey whilst they are there (or whilst they are bailing out) and ask them then. These online surveys have been around for years and now many of them are free (and very easy to implement).
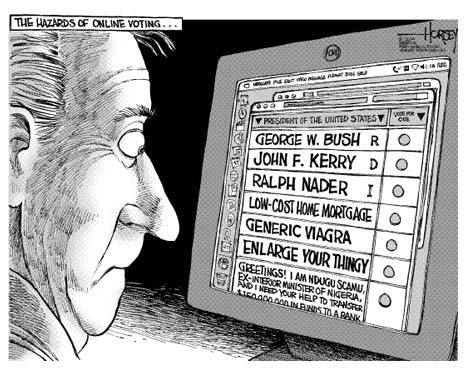
Online voting is a step away from asking your users what they don’t like about a bit of your site –
Intelligent MeasurementThis very easy method of tying up the data that you are producing from your systems can give you a huge return. Whilst doing A/B testing is useful, you need to have some ideas of the things that you are going to change. Asking the users why they bailed out may show you that the reason wasn’t necessarily because of the wording/pictures/order, but maybe more to do with the length of the survey, etc, etc. Really you just want to give yourself more ideas to test with.
Voice of the Customer into Analytics
The other thing that you can do with you voice of the customer is link it back in the other way. And why not. Firstly, you need to think about where you are going to put the data and what you are going to do with it. For example – if you want to know why a customer is bailing out of a particular transaction at a certain point, then you are going to want to have the survey as an exit survey and you are going to want to know why they left (so that you can do the stuff talked about above).
I’d always strongly suggest working out the reason for the survey first, without just plonking it on the site. However I am well aware that many people will use the survey as a reasonable measure of user satisfaction over time, by running the same request over and over. This is particularly true for non profit organisations where user satisfaction maybe one of the KPIs that they monitor.
What you can do though, is collect the data in your web analytics system. Particularly with tools like Omniture where you have the ability to do lots of customisation of the parameters that you collect and insert data where appropriate.
So you have two options in Omniture. Either you can create a whole, completely blank, new report suite and dump the data in there. Remember in Omniture you can set up
multiple correlations between your collected variables, allowing you to do some drilling down into the responses that you may not have thought was possible using the tool that the survey provider has available.
Gary Angel has quite a comprehensive method of collecting this data on his blog (so I won’t repeat).
The second method that you can use, as Gary also mentions is that you can collect the data in your live report suite. There are upsides and downsides of this – firstly you are going to be collecting page views that aren’t really people viewing your site, secondly you may not have all the s_props available to be able to do this (especially if you have lots of questions).
So good I had to use the gag again
This is why I quite like the method that you can use of uploading the information through
SAINT. Just in case I didn’t point it out the first time, you have full correlation ability within your custom traffic variables if you use SAINT. This is amazingly powerful because it means that you don’t have to go through the process of setting up the correlations and you don’t have to worry about using up hundreds of custom traffic variables.
The downside of this approach is that you have to be able to get all the data out of your survey systems and link it back to a primary key. This may be the step that is most tricky. In theory it is just a spreadsheet with the primary key down the left (ie the bit that identifies each respondent) and the questions along the top with their answers in the middle. You can then upload that back into your system using
SAINT as mentioned above. In practice, getting this data may be more difficult than just uploading it in the first place.
I’d also recommend using not just uploading the information into an s_prop, but also uploading it into one of your custom conversion variables. To recap on your custom conversion variables – these work essentially like a series of marketing campaigns. You input your values and then that sticks with you throughout your visit allowing any custom event (or a sale of your product) to be associated with your original variable. These are often set up to monitor people who log in or view promotions on the site. The downside of these variables is that you can’t breakdown more than one at a time, but that’s probably ok for what we are going to do. You can, of course, use the same SAINT treatment as above on your variables if you only want to use one of them rather than one for each question.
What do I do with the data when it is in SiteCatalyst?
Well, without wanting to teach a grandma to suck eggs, there are quite a few things that you could do which could give you an immediate advantage. I’m going to assume that your survey is a random one that is shown to the user at some point in their journey and that you are asking them questions about satisfaction and ease of use of the site (as you probably would do):
- Take you custom traffic variable data and plot your satisfaction against whether a user completes one of your events (eg they used a tool or you sold them something). Are those that are more satisfied using your tools/buying stuff? Why aren’t the one who are unsatisfied using tools/buying stuff? How can we show them the benefits of using tools/buying stuff?
- Breakdown your total tools used/stuff sold by not just whether they were satisfied, but where they came from. Are you mis-selling them something on another website? Can you contact that website and change the message? Are the search terms they are typing in showing a different levels of satisfaction/ease of use? Does it depend on the landing page? Can we change the landing page?
- Breakdown each of your different types of tools/things sold by how satisfied they were. Do certain journeys make users more satisfied? Can you replicate those journeys on the ones that made them less satisfied?
Suddenly we are now going from a stage of knowing how satisfied a user is with the site to know what it was that was making them satisfied/unsatisfied. Plus we have all that data in the custom traffic variable that we can play with in the normal way too.
I will add one last thing and it is very important. User satisfaction and the use of a tool (for example) may be correlated, but this is different from causation. A user may be satisfied because they used a tool or they may have used the tool because they were satisfied.
XKCD – making the world a bit more comic orientated


Leave a Reply