Are any Omniture reports ‘Standard’?
As per usual, this post is inspired by someone else (isn’t that always the way?) and it has taken me several sessions to write. This time it is inspired by Avinash Kaushik who wrote a post yesterday on “Analysis Ninjas: Leverage Custom Reports For Better Insights!” and it got me thinking about Omniture. It seems to me that in SiteCatalyst, you don’t have any standard reports, they are all custom reports, but someone in Omniture (or in the organisation I work in) has gone around tried to make the reports standard. Maybe what I should do is go back to the admin of Omniture and turn all the metrics on the main reports to something completely ridiculous that you would need to change in order to get any sense out of. Standard metric for the pages report? Why that would be ‘Reloads’ not ‘page views’.
Anyway, whilst I could sit and rant about that, what I thought I’d do is point out some of the nice features available in Omniture that allow you to do some of the custom reporting that Avinash talks about in his posts (and it is amazingly simple). But, first things first:
Custom Traffic Variables
These are not custom reports! Seriously they are not. They are just standard reports with something slightly different in them. This is the equivalent of your ‘pages’ report, except you’ve populated it with something else instead of the page name. Your first target with these reports is to work out the context of the reports and what you are going to do with them. Remember these reports are not conversion based, they are based solely on your normal traffic variables: Visits, page views and Unique users (plus the associated Entries, Exits, Single Access, Time spent).

Do you not have all these metrics enabled for the custom traffic variable that you need? Ask your account manager (you might have to pay a bit more – but nothing more compared with the overall contract).
Remember that your reports can be broken down by where people came from using the little green box next to each of your values in your custom traffic variable (remember to make sure you set up your data correlations here), however you will then be limited to having Page Views as your metric.
It’s a good start that we’ve made here because the first thing we’ve done is realise that the standard metrics we want aren’t the ones that are usually put on the screen. This is something that you need to remember. Also remember that whilst different people want different metrics, you don’t need to put them all on the same report, because it will be a nightmare. Not least of all because it won’t be sorted in the way that any of them want. Create as many new and varied reports and let each person have their own one. Give them a login, tell them to save it to their favourites.
Even better, give them a link to the report with their login details and then tell them to save it in their tool bar as a favourite.
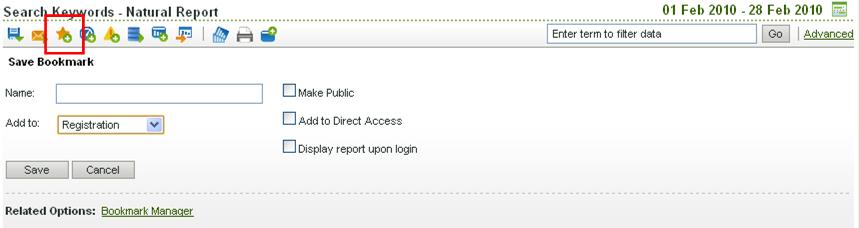
Use the Bookmark option to save a copy of the report in your header to return to easily at a later date
Custom Conversion reports
Custom conversion variables reports are not custom reports. They have the same issues that you do with your custom traffic reports – they are all tailor made and your job is to customise them even further to give you the information that will help you make your KPIs.
Custom conversion reports are conversion reports, but you need to add in your conversions first. Conversions are your custom events (this is getting confusing right?) and your Purchase events (which are just custom events with a name). This basically means that as well as having your campaign reporting running separately from your traffic sources report, you can set up another X number of random ‘campaign’ that will run independently of each other, but can be broken down by one another.
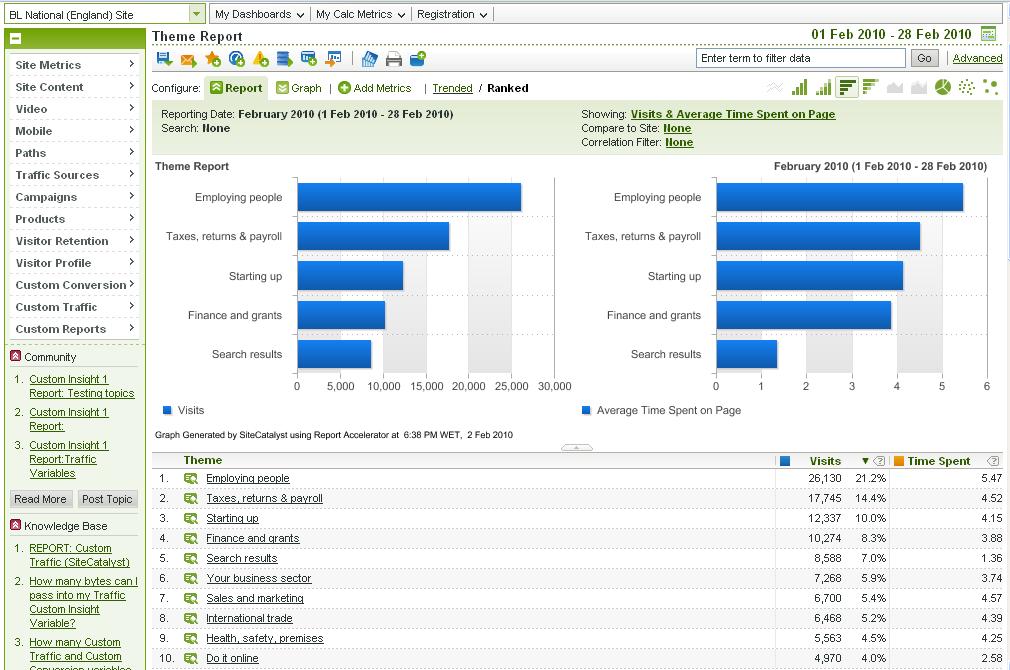
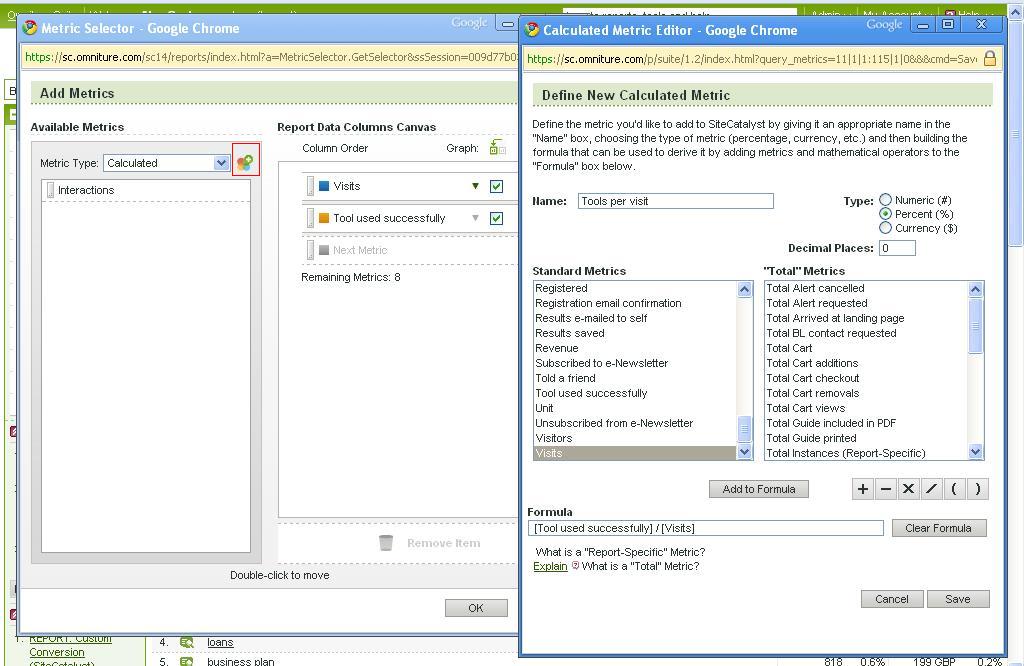
Don’t understand what I mean? Well let me give you an example. We collect our internal search terms that people type into the site in a custom conversion report. We also collect when people go off and use one of our tools (as a custom event). Because of this we can tell you if a person who searched for a search term went off and used a tool. This is a key metric for those that are optimising the site – we want more people to use our tools (it’s a sign of engagement with the site, seeing as we don’t sell anything). We can tell how successful our internal search engine is based on whether people use the tool or not.
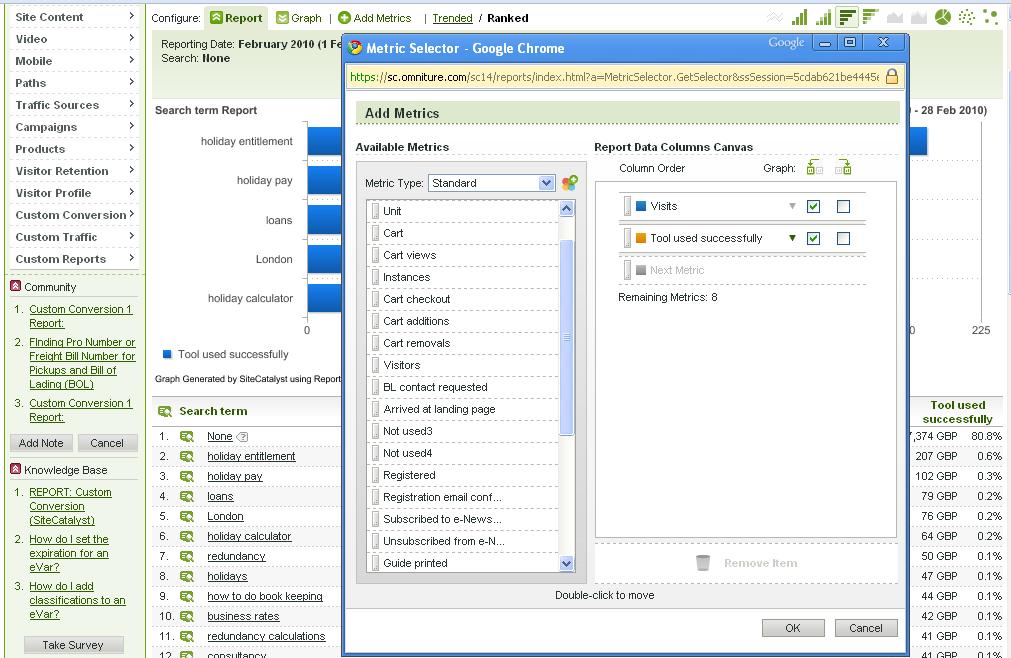
But that information on its own, isn’t quite enough. We also need to know how many of them were searching for it, so lets use that add metrics button to give us the additional metrics we need:
In fact, I probably want to know tools used per visit, so I could create a calculated metric based on that. Calculated metrics are great, but only in the right context. And more importantly, as Avinash says – you don’t want hundreds of metrics in the same report. Taylor each of your reports so that it gives the person you are sending it to a few really key metrics that will help them. If it means that they come back asking for more information then that is a good thing.
To create your own metrics is really simple in Omniture. When you add in your additional metrics (like in the picture below) you’ll see a little drop down at the top of the page and a coloured blob next to it. Click on the coloured blob and you’ll be able to add as many calculated metrics as you want into your table. As I’ve just said though – don’t do this.
When you’re done – why not share it with another user? This is one of the greatest things about a programme like Omniture (and Google Analytics, as shown by Avinash – plus I’m sure a whole host of other analytics solutions), you can easily share what you’ve been doing with someone else. And of course, it always just seems to get easier and easier. So you’ve got about four options:
- Download it in a format that would best suit the person you are giving it to and then send it to them. Alternatively you could download it into CSV and then turn it into some nice spreadsheet. This is my least favourite option – but it can work well if you are going to run some commentary with it
- You could send it directly to them out of Omniture – this option even allows for you to put comments into the report or some notes into the accompanying email. This can sometimes be a nice way of doing it because you can send it in HTML, so all that formatting you created in your dashboards isn’t lost.
- You can turn the report into a dashboard (as alluded to above). This can be a one report dashboard, if you want it to be. No time here for adding in lots of ‘nice to haves’ – lets keep it as simple as possible. Then you can give the person you want to see it a log in to Omniture and then show them how to subscribe to the dashboard that you have shared with them. This is a simple way of getting them more interested in the detail – they’ll probably ask you for some more information and you can then tell them you’ll show them how to get it.
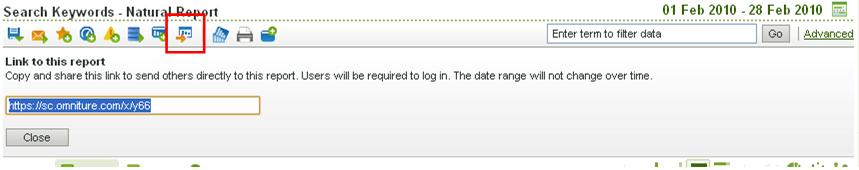
- You can send them a link to the report. This new ‘link to this report’ feature allows you to get people who would normally pester you for data to actually log on. No more of this “I can’t remember how to find this report” rubbish. Get them in there, if they want something more difficult they can work it for themselves. Even better – send them a link to the dashboard you’ve just created!