Analytics of Product List Pages
Thanks to everyone who came to MeasureCamp a week or so ago. Kelly McClean and I presented a session on the analytics of product list (listing, lister, etc) pages (PLPs) which was actually a copy of the presentation that we gave at the London Digital Analytics Meetup Group earlier this month. Whilst both presentations are basically the two of us talking over a couple of slides, I thought it might be useful for me to formulate the thoughts and questions into a blog post (and show the slides, of course!).
Why?
Every time you are thinking about measuring something, you should be thinking about why you are measuring it. What do you get out of this? What is the purpose? What does your measurement framework tell you about it?
Usually (and I don’t want to put words into people’s mouths) one of the key goals of the website is to sell products. Therefore when you are thinking about anything in this area your number one thought should be “Does it help me sell more products?”
When looking at PLPs the temptation is to start thinking in terms of ‘micro conversions’ and those steps up the funnel to the sale: Did it help me get more product page views, did it help me get more basket views, did it help me get more checkouts, etc. The micro conversions are all well and good, but remember what the purpose of your site is (and it isn’t always just selling things – you might have a preference over products, you might have want people to save for later, you might want people to add more of one product, you might want return visits to easily access frequently bought products, you might want to showcase new products, etc).
PLPs are something that you can change to help you get to that end goal. In an eCommerce environment they are one of the early points in a users journey (although not always – some users might arrive at product pages so check your analytics) and something that can significantly impact how likely someone is to buy. The things you can change on that page are therefore very important and will make up a number of the segments you’d like in your measurement framework.
What?
The next question you need to ask yourself is what should you be changing them to. Analytics can tell you what works and what doesn’t work, but it can’t tell you what you should test to see if it works or not.
The most important thing is visit intent. What do your users want to do on the pages and how does that fit in with your business needs.
To do this there is one simple way: Ask your users.
You can do some extensive user testing and get some of your target audience into a room and ask them. You can put up a survey on the site and ask them what they are hoping to achieve. You can stand in the street with a sign outside the office asking for someone to come in and help you for five minutes. You can ask a friend or family member to come in and talk to you (assuming they are relevant). Anything that you can do to talk to some people to find out what they are trying to do will help.
This will help your design decisions in a tangible way. For example:
- If your users are browsing to see if there is something they like and then they’ll buy, then you want to set up you PLPs to allow them to see the full range of products that you have to get some interest (so if you have 5 colours of a product, you’ll want to just show one, with the option to pick colours on the product page)
- If your users know what they want and just want to find the specific colour/taste/smell/size then you’ll want a separate one for each so that they can see what options there are on screen, so you’ll have a separate option for each type on the product list pages
As well as changing how you set up the main portion of the page, it can also help dictate which facets you would like on the left hand menu, how many products you have, how you present the results in the main frame, etc.
What to Measure?
Everything. Next.
Ok, fine, I’ll give you a bit more detail. Everything that you could possibly change you should measure. If you can’t change it, don’t bother measuring it because reporting against it does you no good at all. But you’ll be amazed at how many things you could change (look on slide 4 above).
Here is a product list page (sorry if this is your site!)

What do you want to measure here:
- Measure anyone who clicks on a facet in the left hand menu (what they clicked on and in what order)
- The current state of the facets (because a user might end up on a page with one selected/deselected without clicking on it)
- The order that the options are in
- The number of products that the user has on the page
- The number of products that the user could see in total
- The Page they are on (or how far down if it is never ending)
- Products on sale, products that are not on sale, products that are out of stock
I could go on, but here we have a list of things that we can immediately make changes to and see if they have an impact on our KPI from above. The reason we would want to measure the use of these is because we can change them in tangible ways that could increase conversion.
Don’t believe me? Here are some changes::
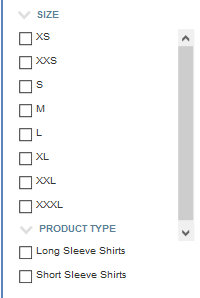
Firstly we could rearrange the order of a particular facet to see if has an increase in conversion rather than leaving in the tired old order (of course this would make more sense to rearrange size in descending order or colours based on the one you have most of or the one most people want):
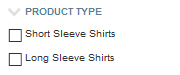
Reordering facets themselves:
Then you can change whether ticked means that it is selected or unselected. Then you can change whether ticked or unticked is set as the default. You can change whether the list is a set of checkboxes or a drop down box:
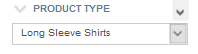
Here we have a number of small changes you can make to your facets that you can measure the impact of, not just on whether people use the facets but your site’s end conversion goal. These are things that you should test through a multivariate testing tool. These small visual changes will have small, but noticeable impact on your site conversion rate and the number of people getting to your end KPI.
Leave a Reply