I’ve been in my current job for about a year now and I’ve been working quite a lot with WebTrends (as well as Google Analytics and all sorts), but this week I’ve been working on SiteCatalyst with a client again. It reminded me of a post that I wrote back at the end of 2010 on what SiteCatalyst should do for version 15, so I thought that I would write one for WebTrends as well.
1. Live Segmentation
WebTrends can do segmentation and it can do it really easily. You can apply filters to individual reports in the backend of the system and you can apply whole filters to entire profiles.
This is very powerful.
But it is misused. At the moment it is used to create reports that can be used on a regular basis. This is reporting.
Segments should be used to allow analysts to create analysis for insights and recommendations. This is one of the pillars of the analytics maturity model for organisations. At the base level you are producing reports, at the more advanced levels you are doing analysis. If you have to know in advance of your users doing things that you need the reports then your not doing analysis, you are doing reporting.
The trouble WebTrends has is that the people using Analytics tools have changed in the last 3 years and WebTrends hasn’t. You need to be one step ahead of your audience.
2. Standard Custom Measures in any report
Setting up measures in WebTrends is one of the most annoying things ever.
I want to be able to code on the page WT.metric1=true and metric1 will appear in any report that I want it to.
I don’t want to have to go into custom measures and create a new one.
I don’t want to have to add it to every report in the back end.
I just want it to be an option that appears in all reports when a user wants it to. It may not make sense with the visits and the page view based measures, but I’ll let the people looking at the reports work that one out.
Currently the barrier to adding measures to reports means that I have to spend too much time up front working out which measures work in which report. I have to set up measures that are visit based or page view based depending on the situation and if I have too many of them then it ist5 annoying to have to create two reports. Just let the users add them as they want.
3. Second dimensions on the fly
SiteCatalyst does it, Google Analytics does it, even educated fleas does it.
You have two reports. One has, say, the keywords that you are bidding on in your search engine. You have another report that shows the search terms that you pick up from the referrer field when a user clicks through.
Want to break one down by the other?
Tough, unless you set it up in advance.
However, it turns out that you want one dimension broken down by five different ones in various different ways. That shouldn’t need five individual reports, it should need one report that you can add a second dimension to on the fly.
Google Analytics does this in a way by allowing you to break each report down by a subset of the other reports, depending on which one it is. This would seem like the safest solution for WebTrends, but WebTrends has lots of custom reports so a SiteCatalyst style breakdown might work better in practice.
4. REST user interface
It’s great that you can just download data from reports by using the API so that you can create your own interface. You can put the data in your third party systems much more efficiently and you can put data into Excel however you want.
What Rest really needs is a GUI for people like me who don’t want to have to bother with coding stuff on pages. What Rest needs is a
Report Builder.
Why does Rest need to do this? Because Rest has been lost in a past that no longer exists in most companies where the analytics tool is looked after by the IT team. The Analytics tool should be looked after by a Marketing team (or the end users of the reports, who are usually Marketing). Because of this the way of getting data into excel should be in the most simple fashion possible.
5. Improved Dashboards
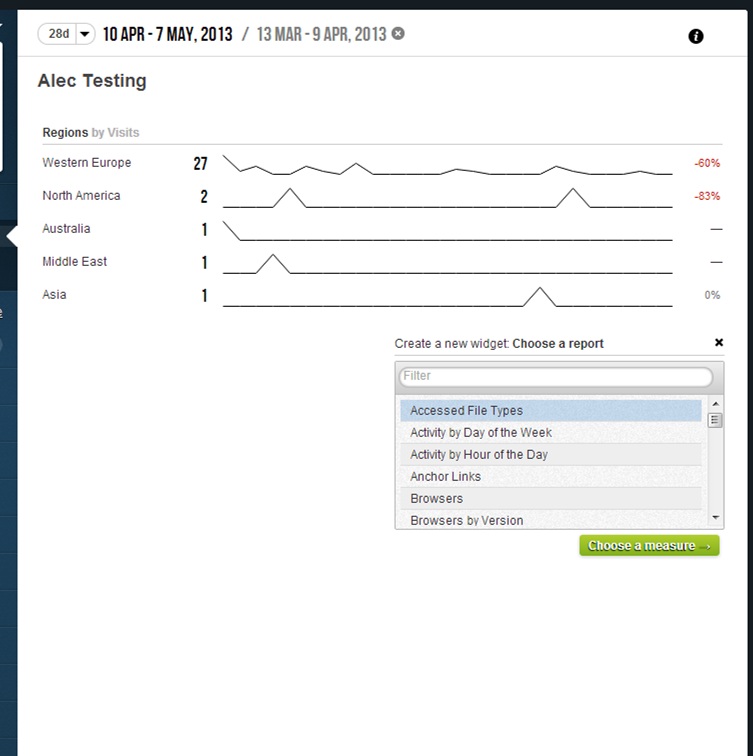
Dashboards in WebTrends are frankly quite poor and probably unusable.
I wouldn’t recommend any of my clients use them and instead export the data themselves into Excel to manipulate there. I think it would be rare that you wouldn’t advise even the basic user to manipulate some of the data in the tool itself.
This is probably a symptom, slightly, of some of the other shortcomings of the tool rather than a symptom of the dashboards themselves.
I could probably write a whole blog post on things that could be improved in the dashboards, but starting with:
- Simple filters of the reports
- Adding more than one measure to reportlets
- Having more than five lines in the reportlets
- Sharing the dashboards with other users
- Adding in custom stuff (like a box for normal text to explain stuff)
6. Targets
I’ve spent the last twelve months telling clients that they need to set KPIs that they know reflect their business objectives to build confidence in what they are doing.
Having set KPIs they need to give targets to those KPIs so that they can tell whether they are performing well or not.
The favourite question is “What does good look like?” Good looks like hitting your targets for your KPIs. How do you know whether you’ve hit them or not? You have uploaded them into your analytics tool and the reports that you get in your newly created dashboards show how you are performing against them.


I agree with you, I’m in the same boat. its not right having to create multiple reports to answer one question. I don’t even want to get into how messy this becomes over time. cranking out reports won’t cut it anymore, users should be inspired and empowered when they log in to a tool.
I want it for Analytics 11. No reason to wait two versions. 🙂
Couldn’t agree more. I don’t understand how WebTrends has left their flagship product fall so far behind. I’m wondering if they even keep track of competitive product features any longer. It sounds like they are more interested in launching new technologies (Streams) than supporting and enhancing the solutions they already have (Analytics, VDM/Segments).
Perhaps you should use this for your rest queries?!?!
https://generator.webtrends.com/
It has been available for ages and is in it’s 3rd version 🙂
Main issue they need to solve:
They need to change the backend from flat files –> relational data base. Until that happens, there is zero segmentation and zero brakdowns unless you build it first. It is really that simple and I am quite sure Webtrends also knows this. I think it is easier said than done to take a system with that many interreliabilities and transform it into a RDB.
Nevertheless, unless they do this, I am also forced to agree that SiteCatalyst and Google Analytics has the upper hand. That being said, there are also a long list of thingsd in both those systems that suck.
1. Drilldowns are clunky and not multilevel without it all becoming severely unusable.
2. No calculated metric in GA?
3. No date comparison in many reports in SC as well as in their (By the way fantastically flexible) dashboards
4. limitations on parameters in SC.
5. specific inability to drilldown between props in SC, unless you use Discover…..why not just put that in SC??
6. Building your own custom reports is nigh impossible in SC. All you are really stuck with is props and eVars and breakdowns.
But I fully agree. IF WT made available segmentation it would go a VERY long way!
Webtrends have announced a summer release in August 2013.
http://forums.webtrends.com/webtrends/topics/analytics_10_7_release_date
Unfortunately I do not work with Webtrends any more. My patience ran out