What to do with the demographics of your twitter followers with demographicspro
When I got an email in my inbox from Schmap the other day about a new tool they had released I thought I was going to leave it sitting in my junk box. In reality I sent it around the office to everyone telling them about it and asking if they had any clients who might want to use it. We probably won’t do, because of the nature of most of our clients (they work in regulated markets with few twitter accounts). But you guys could be interested in it, if I tell you what it is and how it works.
What is this new tool?
Demographicspro is the name of a new tool and was launched last week. The tool costs money, but not very much – if you’ve got a tiny account like mine then it could cost about $20 for a one off analysis, in fact if you’ve got anything up to 10,000 followers it will cost as little as $80 for a one off analysis. You can, of course, buy a plan for regular reporting to show how your demographics change over time.
How does it work?
The company says it uses algorithms to crunch proprietary data across four general focus areas — network, consumption, language and physical appearance — though it doesn’t say where it comes from. At any rate, it’s better than what Twitter offers brands today, and it spits all of this information out into your choice of an Adobe PDF report or Microsoft Excel spreadsheet.
What data do you get?

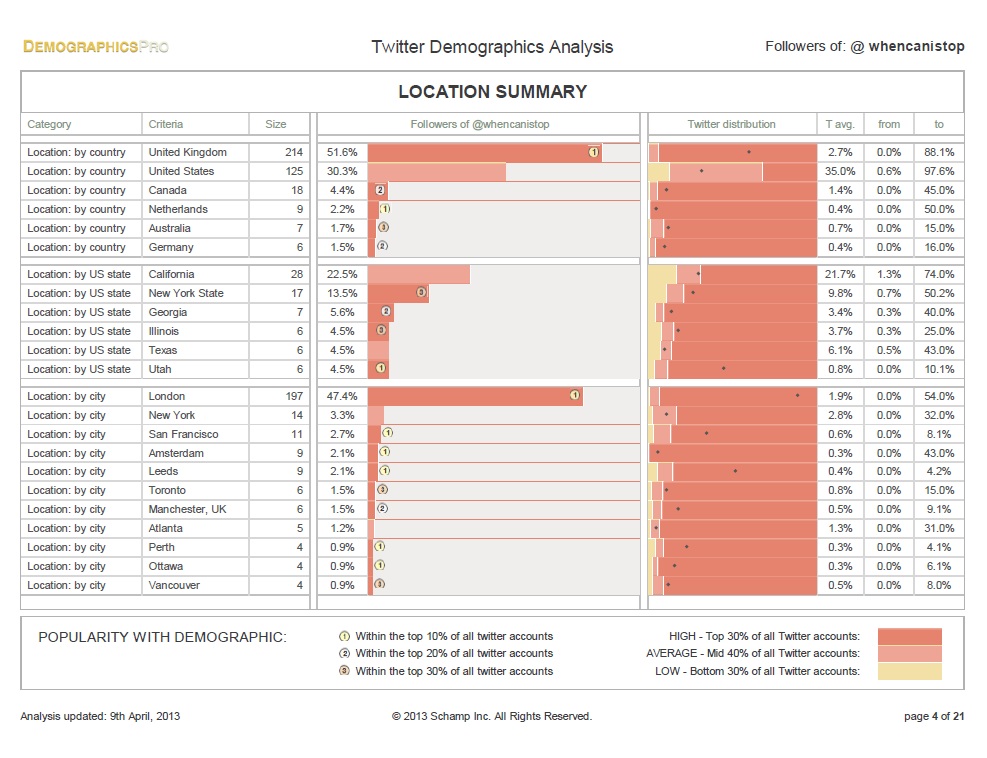
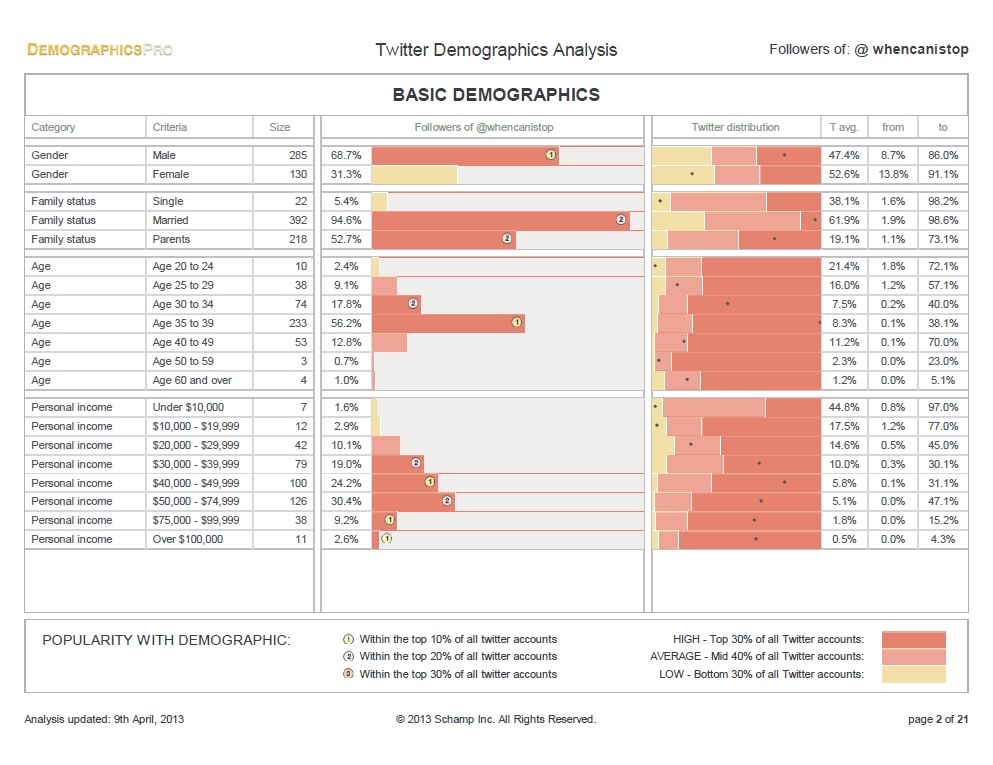
To give you a quick flavour of some of the other bits of information you’ll get, above we have some information on the location of the followers, what the interests of followers (77% are interested in technology – I think that someone could do with breaking that large group down a bit in future developments) and what occupation the followers have:
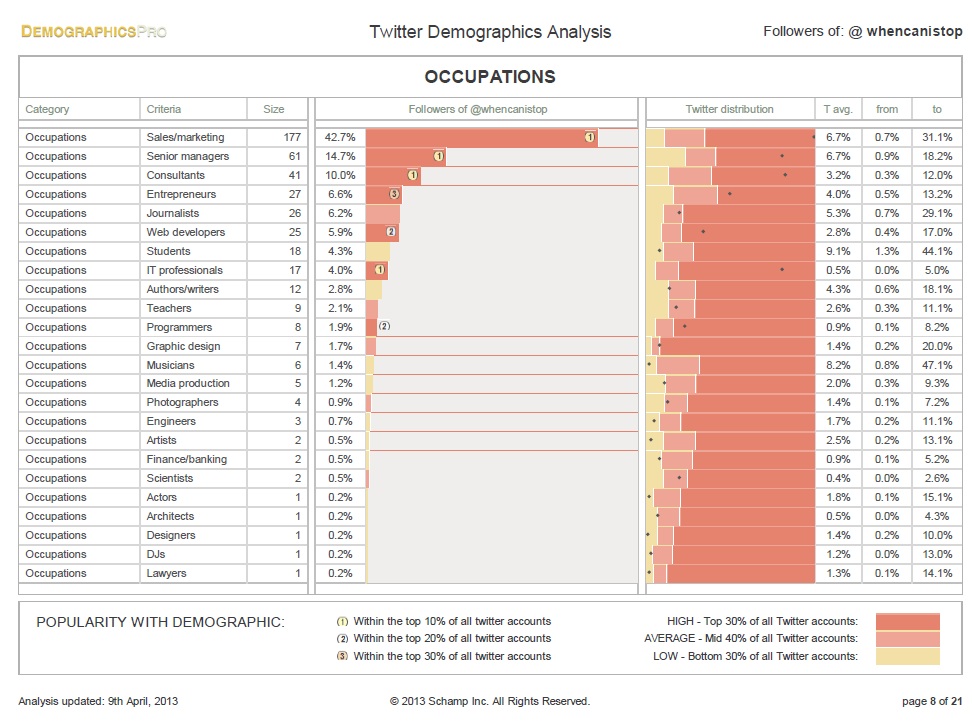
Is it any surprise that so many are into ‘Sales/Marketing’ (does ‘Sales’ as a job even exist any more? And if it does, these people are surely really different from Marketing people that it isn’t worth grouping them). It is nice to know that I’m also connected to a lot of Senior Managers – that should make it easier to sell my services over Twitter (although I do use my twitter solely for professional purposes, so maybe it isn’t so much of a surprise).
We also have information about which people your followers are likely to follow too (Pete Cashmore appears at the top of the list – he must be very popular around my groups!). We also have information on the sorts of Brands that my users are interested in:
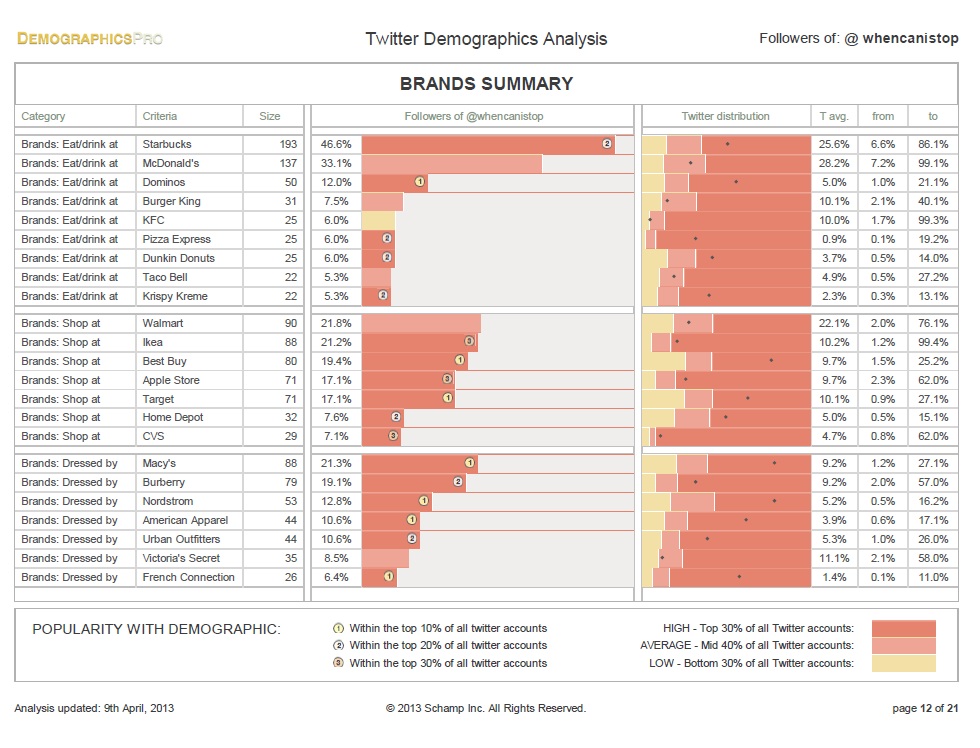
These bits of information are probably found from various bits of data about check ins, tweets and generally linking demographics of people to the demographics of the sorts of brands they like. Here it is more important than ever to look at the dot to see where you sit compared to the global audience. KFC appears high on my list, but my users are far less likely to like KFC than the whole world. Me tweeting “@KFC, isn’t it great! #chickenforlunch” probably wouldn’t go down so well.
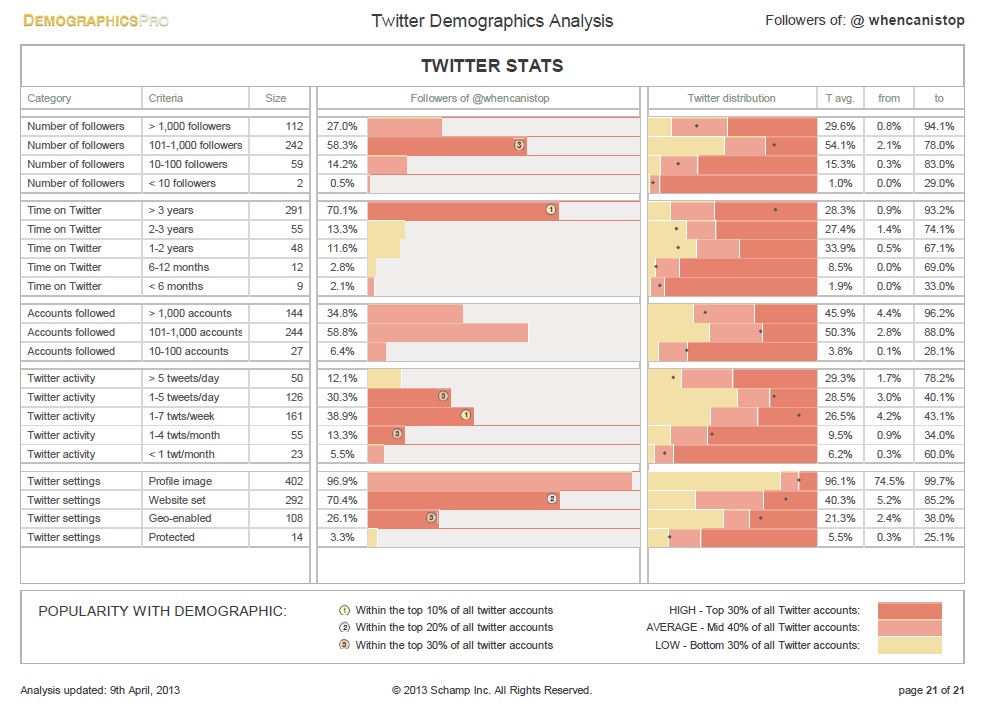
Finally we have some information about how long these people have been on twitter, how many followers they have, how many they follow and their daily activity. Knowing how often my followers tweet gives me some insight into how often I should be tweeting too (my first tweet was just over 5 years ago and I’ve tweeted almost 1,500 times, so once a day makes sense).
How can a Brand use this data?
I see there being five ways to use this data:
- Tone – you can use information about your followers to dictate the tone of your tweets. You may think you know about them, but you may not necessarily have the level of detail that allows you to decide what tone of voice you are going to use.
- Compare to peers and competitors – use the information that you gain about your brand and compare to peers and competitors by running the analysis on them too. You can gain insight from comparing your tactics to theirs and the results of the followers.
- Work out what brands you might want to partner with – knowing other brands that your users are interested in may allow you to build strategic partnerships with ‘upstream’ or ‘downstream’ brands – things that are related to your product, but aren’t direct competitors (eg if you sell socks then you might want to partner with a shoe company).
- Use the general interests of your users to create personal tweets – if you know what users are interested in then you’ll know whether to make tweets about events (eg my followers are universally uninterested in music, tv or film – so I know not to tweet about these things, but tweeting about new technology or social media is encouraged).
- Frequency and timing of tweets – knowing where your users are and how often they tweet will let you know when you should be tweeting for maximum visibility and how often to get the users attention
Remember though that your overall twitter strategy should integrate with your overall strategy and should drive real world outcomes. You get data from this tool and you need to analyse it to get insight that you can use to change stuff. You then need to use your standard measures to show the impact of these changes. You can start using this data as part of your metrics, of course, and run this analysis on a regular basis.
Leave a Reply