4th Birthday for whencanistop
Happy birthday to me, happy birthday to me, happy birthday dear whencanistop, happy birthday to me. Yes, four years ago the humble blog that you are reading at this precise moment was born (well it was born four years ago since I wrote this post, you might be reading this months or years since I wrote it!). So the question on your lips, is presumably how has it all been going? In case you were wondering, yes there was a similar post when the blog was two years old, along with a few posts before that about how the blog was doing.
In the four years of this blog my life has changed significantly too. When I started doing this blog I was working for RBI, a company that owned a series of ‘news’ websites aimed at the business to business sector. Blogging there was something that was relatively new in a business sense there and so this started as a bit of an experiment (firstly internally, then on this blog) to show some of the organisation about how it could be done. The start of a decline in advertising revenue meant that I decided the time to seek new employment to further my career and I started working for Serco on BusinessLink – a Government website aimed at businesses. This was a slightly different world from that of RBI – much more risk averse and that meant my blogging was a bit more conservative (little talk about work!). Now in my current role as a Business Analyst at a consultancy firm the shackles are back off again, but not quite as much as at RBI (you’ve got to protect the customer’s privacy!).
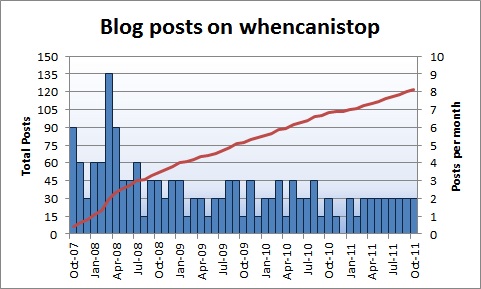
So how has the blogging been going? The aim was always to write two posts a month and make them of at least 1,000 words each. So how has that been working out? I’ve included this one, just to massage the figures a little bit:
Two blog posts a month seems to be working at the moment. I’m also working well towards 1,000 words per post. This year I have only written one post that is under 1,000 words and two that have been over 2,000 words (averaging 1,350 words).
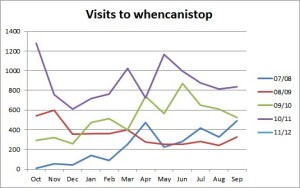
So how have the visits to the site been working out? That is as much a measure of the success of the blog as anything else:
I think that I could have expected a slightly larger increase year on year, following on from a record month in October 2010. There have been three months that have had over 1,000 visits in the month and that suggests that this is a successful blog.
Also useful information to know is that in that time my search traffic has increased month on month more or less throughout the entire time. In fact, most of the peaks and troughs that I have in the visits to the blog are caused by situations of large numbers of visits directly or from referrers (typically twitter, but I do also get a large number of visits because of the blogger tool bar up there, I don’t know what causes me to appear when people click on ‘next blog’ but I’m sure it is something exciting).
One of the advantages of writing lots of long blog posts is that you get lots of long tail search traffic. This is particularly true of this particular blog. 8,757 different search terms have generated 14,480 visits. It’s difficult enough to work out what is going on with a few keywords, but when half of your visits from search engines come from a phrase that was used to visit your blog just once, it becomes increasingly difficult.
In fact, just by looking at the visits generated by my number one search term, funnel analysis, give you an indication of how difficult it is:
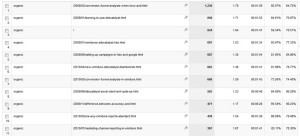
Rarely do I get more than 10 visits in a month for the search term and I haven’t got more than 20 a month at all. In fact, I did the same graph with all phrases that included ‘funnel analysis’ and it was only about double that. So maybe a more efficient way of looking at the data is by looking at the landing pages that people landed on:
So given this piece of information (I’ve included the top 11 here, because the home page is in the list and that is mainly brand related traffic), it is interesting to note that my conversion analysis post is the most visited. Maybe it is also interesting that I followed that post up with a post on conversion analysis in SiteCatalyst, because of the success of this post. It is also number 7 on this list. A wise decision you may feel. My next project should be to create a post on conversion analysis in other tools (such as Google Analytics). And actually, if you look at the data there was a marked uplift in traffic to those posts from search at the time of the publication of the second post:
So this makes the last part of this post interesting. Lets look at a drilldown of content based on the time of the post was put up:
Now this looks interesting that 2008’s posts have generated the most traffic (remember that my conversion analysis post was from 2008). But it is an interesting way of looking at the data. Of course 2008 was the most viewed content since 2007 – it had the most posts and the most time to generate traffic. It is hardly surprising that if you look at just this year 2010 and 2011 have generated the most visits.
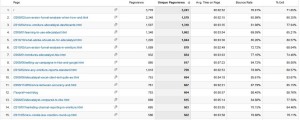
Finally looking at the actual content that people are looking at:
There is a post from 2011 in the list (all be it at the end of the list). This is the sort of thing that I will use to help build the next couple of posts, given the interest that the readers have in the subjects. It won’t stop me from producing posts that are more news related, but I am mainly going to be keeping those to the new blog that I’ve been writing at digital transparency. The top ten for those of you who want to click:
- Conversion Funnel Analysis: When, How and What
- New Omniture SiteCatalyst Dashboards
- Learning to use SiteCatalyst
- What Adobe should do for SiteCatalyst version 15
- Conversion Funnel Analysis in Omniture SiteCatalyst
- Omniture’s SiteCatalyst HBX
- Setting Up Campaigns in HBX and Google Analytics
- Are any Omniture reports ‘Standard’?
- SiteCatalyst Excel client isn’t quite as good as report builder
- The difference between Accuracy and Precision





Leave a Reply