Learning to use SiteCatalyst
As you may (or may not) be aware, I have learnt how to use many different web analytics tools over the almost five years that I’ve been an analyst. When I first started at the AA we used Redeye, where we mainly downloaded a load of stats into an internal database which we then queried. At esure we started with WebTrends, but it wasn’t set up well and we were moving to NetGenesis. At RBI I used HBX, although again we had a version of WebTrends on Demand that I had to use. Not to mention I’ve used Google Analytics and Microsoft Adcenter Analytics on this blog. Now I’ve started working for BusinessLink (one week in), we use SiteCatalyst.
If you remember one of my previous posts (linked to just a second ago) I’d actually grabbed hold of SiteCatalyst before, but only for a dummy account. This time around, I am learning it on a real site, so I thought this post could be on the things that I’ve been doing, so that if you have to learn how to use a new tool, then you’ll be able to think about this. I think there are three things that you need to think about when talking about new tools and (in no particular order):
- Mapping the standard reports and understanding the user interface
- Understanding the naming conventions for the tags on the pages
- Understanding how the metrics are calculated
Mapping the standard reports and understanding the user interface
The UI is the one that I always focus on first. There is a reason for this – everyone else will know the tool based on the user interface and will ask you about reports based on their names. This is easy if it is the ‘visit’ report, because that is fairly obvious what it is. However if you’re asked about a ‘Correlation’ report and you have no idea what they are on about, then you’re going to be in trouble.

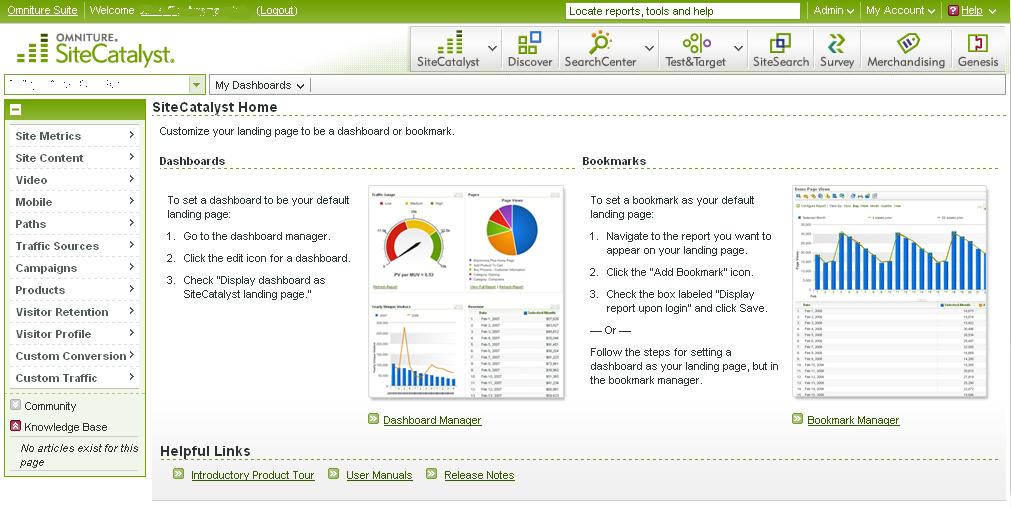
The real disadvantage of SiteCatalyst, unfortunately, is that they completely redesigned the UI recently. So whilst learning one UI is fairly easy, really you have to learn two, because there is a whole group of people who are still using the old one.
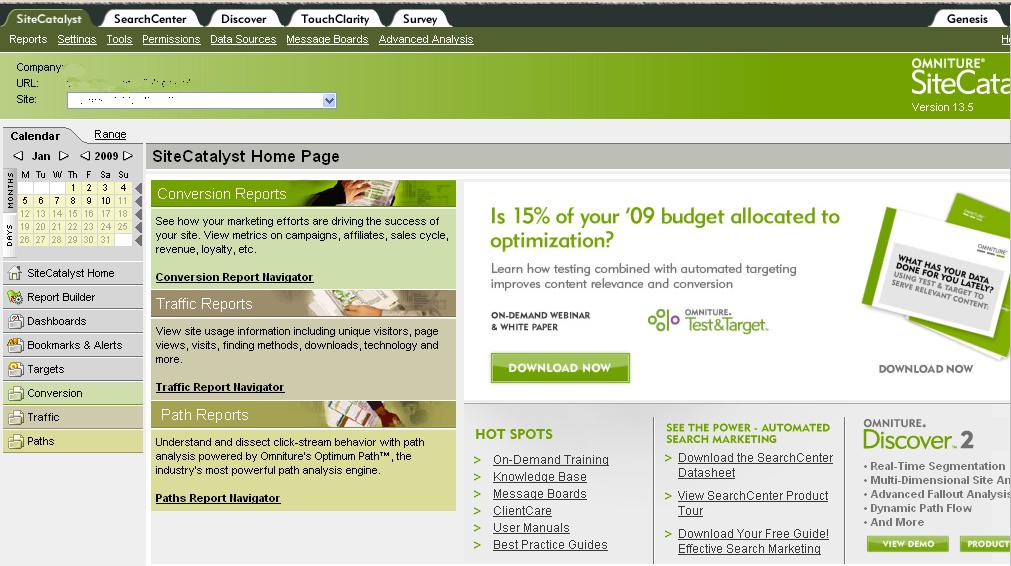
As you can see from the pictures, these aren’t just a little bit different, they have an entirely new navigation scheme, so the ‘casual’ users are not going to move to the new one if it means they have to learn a whole new nomenclature.
However Version 14 has some major advantages. The main one of these is that when you select a report, whilst it may take time to load, it seems quicker, because it doesn’t reload the whole page. And because it doesn’t reload the whole page, there is an opportunity for you to change your date ranges and general report requirements in your header for each report.
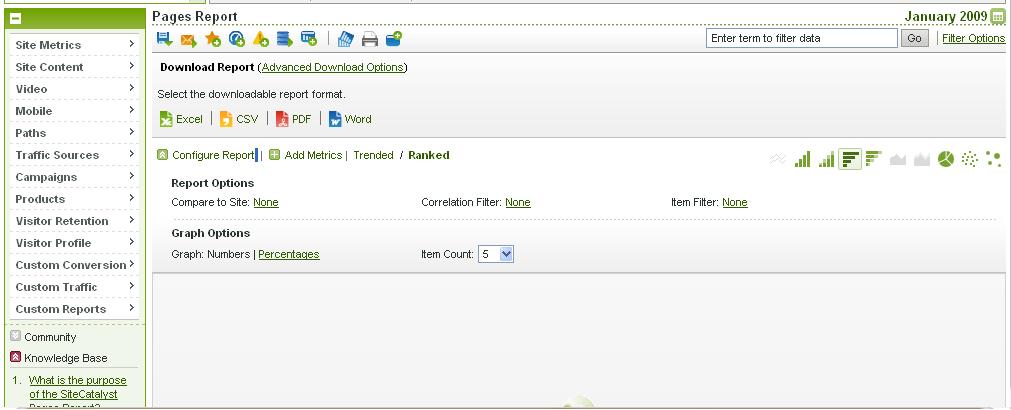
Whilst in version 13.5 you would have your report based on how they wanted you to set it up (or in fact, how you’d decided at the beginning). If you wanted to change it by adding metrics or making it trended, for example, you’d have to do one, wait for it to reload, then the other and wait for it to reload. In version 14, you can do each of these whilst the report is loading and it will reset the loading saving you a load of time.
Understanding the naming conventions for the tags on the pages
This is where Google Analytics has its main advantages over most of the other tools. There is only one standard tag and that is enough for most websites. For Sitecatalyst, you can do that if you want, but the suggestion is that you set it up slightly differently so that you have a custom page name.
However it isn’t quite that simple in SiteCatalyst. Whilst you have a page name, you also have a hierarchy (similar to the multi-level content in HBX) that allows you to group all of your pages in a hierarchial way. On top of the hierarchy there are also a series of custom traffic reports (props) that you can set up on the page (basically a way of giving something lots of independent page names). Then there are the custom events (which can be used for conversion points or however you see fit) plus a series of custom conversions (which can be cross referenced to your custom events for visit based metrics). It seems to me like SiteCatalyst might have named those the wrong way around.
Anyway, now you can see why it is a good idea to work out the UI first. You need to be able to work out where each thing is appearing, before looking at the site and seeing how it is tagged. There are limitations to this – you can’t work out how every tag is set up. There are too many pages. You need to get a general idea and then attempt to look at the exceptions. This is easier if you can look back at the UI and attempt to make sense of your page names, hierarchy and custom options.
Understanding how the metrics are calculated
This is the more complicated bit of the whole thing. SiteCatalyst has an advantage over HBX in that you can add your own metrics to a report, from a standard list and you can create your own using the standard list and a calculation. However, there are some limitations. The ‘standard list’ changes from report to report, depending on how the data is collected.
Most importantly in this is the referring domain, search engine and search term report. This report lists ‘instances’ as opposed to referring visits. Let’s put this into context: In HBX you had to use one of their two standards – ‘Clicks’ and ‘Referring Clicks’. ‘Clicks’ related to someone getting to a page where the referrer wasn’t a page from within the site. ‘Referring Clicks’ was the same, but only if it was the start of the user’s visit. Instances are similar to ‘clicks’. Without going into any great detail, this effectively means you end up over counting significantly.
Anyway, that’s all for now. Tomorrow I am doing some ‘basic’ training with some Omniture trainers. I’m hoping this is going ot fill in a few gaps (and if not, it’ll be at least useful to find out what they are telling all the rest of the staff).
AS you learn more about Omniture SiteCatalyst, feel free to check out my blog which provides product education (http://blogs.omniture.com/author/agreco/)