Three tips on how to get non-analysts doing more
Three tips on how to get non-analysts doing more
Whilst having a chat with some people recently, it became apparent to me that the level of usage of our Analytics tools varies quite wildly across our organisation.  In fact, whilst researching this post I was sure that I had talked about it before, but it appears that I only had on other people’s blogs (mainly Eric’s Webanalyticsdemystified post on the subject – which appears to be years ago!).  So it comes to me again to start talking about how analytics tools have to be set up so that they can be used by many people across an organisation with many different experiences of using analytics and many different experiences of using numbers.
I suppose this is the natural progression of three previous posts detailing what a web analyst iswhat a web analyst should spend their time doing and how you should create bespoke reports for non-web analysts.  Inevitably there was always going to be a new post on the tools that analysts use (and non-analysts) and how they could be improved.  Inevitably I am going to focus on those tools that I know best and how I used them and how they can be used.
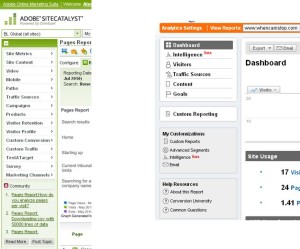
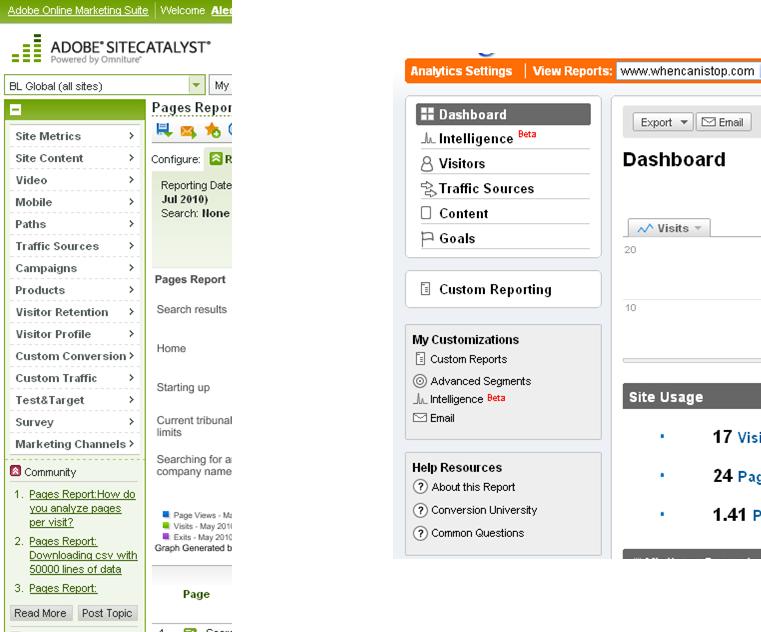
Even from doing something as simple as looking at the main navigation of the two tools when you login can give you an awful lot of information about who the tools are aimed at (even if one of them is now named Adobe SiteCatalyst).  The Google tool is very much segmented for the power user (‘Custom Reporting’) and the casual user, Adobe’s tools on the other hand intermix the very basic with the far more complex (and in many cases the upsell of products to you as well).  I think we can safely say that they’re different tools aimed at different audiences, but that’s not going to stop me giving out some top tips.
1. Dashboards are your friend
In Omniture there are hundreds of ways of creating dashboards using the old systems or the new dashboard technology.  As mentioned already here though, none of the reports that you look at in Omniture aren’t standard in the first place.  Seriously.  There are so many reports out there that the casual user is going to get completely lost and so your job as an Analytics person is to help them find out the things that they need.  This is why you need to create a dashboard with those top 5 things in it.  None of them reports should be standard.  And then you share that dashboard with your team of non-analysts.  They can click on each of the reports if they need more detail, but essentially you’re just giving them the snippets.
In Google it is the same – as Avinash says in his posts, you need to break away from the norm and do something different to give your users the insight that they need.  Those custom reports are actually ways of creating unique dashboards for each of the users.  You want to use them to draw in your non-analysts so that you can take them to the next level.
2. Don’t train on how to use the tool 

I don’t know whether I can stress this enough.  It is your job as an analyst to train people on how to use the Analytics tool that you have in theory only.  What you need to do is train people on how to use the data to help them with their job.  This means that you need to give not just training on the tool, but what the numbers mean and how they can use them.  In fact, it is almost better to do it the complete opposite way around – teach them what they could do if they know their numbers, then teach them what the numbers actually mean, then teach them how them in the tool.  This way you realise that you don’t need to teach them everything there is to know about the tool!  Saves you half of your job.

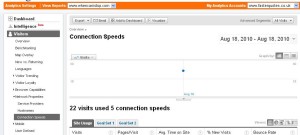
 It’s unlikely you’ll ever need this report

In my training sessions that I give, we all have a laptop, but we start by talking about what our job entails, what our website does and how we could make it better for the users.  Then once we’ve extrapolated that into some metrics, then we can look at the best way of finding that information in the tools (and possibly that might mean that you don’t need to teach them everything).

Or this
3. Numbers = People

This is the one that everyone somehow always forgets.  The trick isn’t to think about the numbers and how to improve them.  The trick is to relate your numbers to user behaviour and then think about how you can change the behaviour.  Too often I have people asking me how they can get more visits to their section, or how to decrease the bounce rate.  Really the question they need to be asking themselves is why do people not go to that section, why do people click on the page and leave immediately (yes, some of them really do get exactly what they want from your website on that first page, but that doesn’t mean they all do).

This is particularly pertinent when you look at search engine optimisation.  You can do all that technical stuff so that Google knows about you and you have all the right links.  But really the question you should be asking yourself is if I was a user, which link would I click on and what do I want from it.  If the answer is not your link, then Google probably thinks that too and will rank you lower.  You need to make your page better for me, as a user, otherwise I won’t click on it.

A confused Alec not knowing why he wants to click on your results in the SERPs

Ok – three tips there for you to help the people in your organisation who aren’t analytics experts.  I’m very big on trying to get people in my organisation to be able to help themselves at analytics and not just be report churners for the sake of it.  What is the net result?  You tend to get more questions on how to find things, what numbers mean, what people should do with them.  Basically lots of mini analysis pieces.  This way you get to do the interesting stuff and become a ‘ninja’ trainer.  And then you can make all the comments you want below about ‘wax on’, ‘wax off’.

Leave a Reply

Your email address will not be published. Required fields are marked *

*