SAINT classification – a walk through


Calm down all those Roger Moore (or Val Kilmer if you’re a bit younger) fans, I’m not going to talk about him at all in here. Sorry. Instead I am going to talk about something that I am doing at the moment at work (surprise surprise) and funnily enough this is something that Adam Greco has talked about before on the Omniture blog, so I’m going to try and do this in a different style, otherwise I’ll be saying the same thing has he said and I’ll be adding no value at all.
Essentially SAINT is a type of classification that you can do in SiteCatalyst that allows you to classify one of your variables into some different stream, if you can’t code it in on the page. In our case, we have a series of content that are written by people who work in various different departments and in various different teams in those departments and we don’t capture in our CMS what they are. However they are keen to know as a department and team within the department how their content is doing as a whole. This is where the classifications work. We have a list that is coordinated for one group of content that describes this one to many relationship and what we want to do is put this into SiteCatalyst without having to code it into the pages.
With HBX in previous companies we did this by populating the custom elements of the tags from the database, but sometimes it wouldn’t work and sometimes it wasn’t right, so you’d have to go back and get your dev team to sort out the tagging. This could be expensive, time consuming and in the mean time you’d lack any data on the stats. Well with SiteCatalyst one of the benefits is that you can run the historic data as well and if you make a mistake, you can correct it and it will replace all the data. How many times have you sat there and someone has said “Oh, I didn’t realise that this fell outside the standard and wouldn’t be included!”
The process starts rather simply. You have to name your fields. In the Report Suites section of your user management, choose the report suite that you want to add the classifications to and then go to edit settings (as in the image below), choose ‘Traffic’ and ‘Traffic Classifications’.
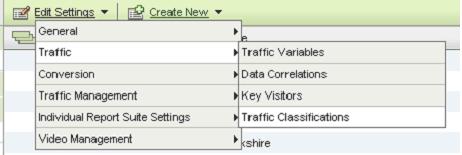
This will bring you up with a new screen, where you can add in your new reports that you want to create:
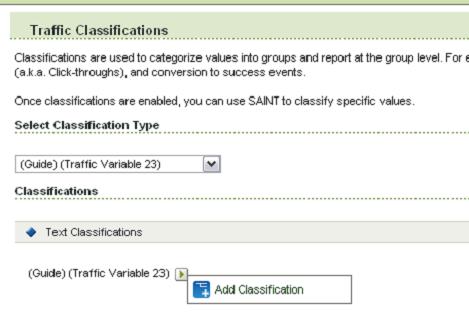

This brings us on nicely to the point where we have to upload the data onto SiteCatalyst. Fortunately SiteCatalyst gives us a nice option of doing this in a very easy way by giving us the template that we can download. Again in your Admin options, you have the option of SAINT Classifications, which this time is the area you want to be looking in:
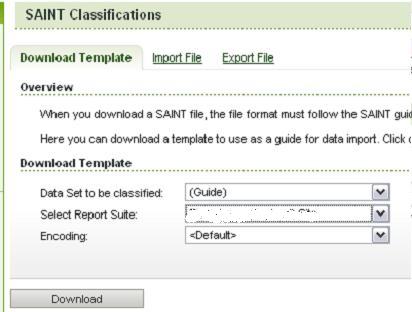
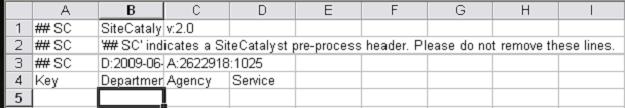
The template you download will have very little in it. It will tell you the title of your columns and a few lines at the top that don’t really do anything else. This is where you need to put your classifications in. So your first column (the key) will have the values that appear in SiteCatalyst already (in this case it is the name of our guides) and in the second, third and fourth (and however many other classifications you have) you can put in the other values:

Alec
Very well written!The best part about SAINT feature is how many different ways it can be used.
Great Post!
Hey Alec,
Nice post!
Is it possible to pass multiple, comma separated tag values through SAINT to Site Catalyst for reporting?
Best,
Jenny
Hey Jenny,
I’m assuming you mean you want to make the value in the report equivalent to more than one value in another report (eg leggings could be both trousers and tights, so you might want to classify it against both).
Currently you can’t do this with a standard variable. If you wanted to do this you could do a couple of things:
1. Put them in as comma separated and then you when you want to see “tights” you’ll need to add up “tights”, “tights, trousers” and any other variation
2. Create a “tights” classification (the values of which are ‘yes’ and ‘no’ – this isn’t ideal if there are numerous versions like this – but you can do through autoclassification if you have already put them in as a comma separated list)
3. Use segments for the breakdowns (managing this can be a pain, but at least you aren’t as limited as you are with classifications)
4. Use the primary classification and ignore any secondary ones
Hope that helps!
Thanks,
Alec
Thanks Alec! Appreciate your help.
Sorry for not being clear earlier.
I am trying to pull multiple tag values for 1 tag category into a single column in the SAINT export classification.
In your example above, ‘Leggings’ is the tag category and ‘Tights’ and ‘Trousers’ are the tag values. The classification doesn’t accept Tights, Trousers (comma-separated) in the Leggings column.
I have gone with #2 in your list above. But as you mentioned, this is inflexible, hard to keep updating when more tag values are added and will miss tag values if the classification is not updated.
Can you please suggest/explain some of the options?
Thanks much!
Jenny
Hi Jenny,
Sure:
1. One option is to include both of the classification in the values: so “Leggings” => “Trousers, tights”, “Jeggings” => “Jeans, Trousers, tights”, Tights => “tights”, “Pop Socks” => “socks, tights”, etc. Then when you run your report, you’ll need to do a search for all the different values of “tights” and then add them together (with the caveat that there may be some overlap in visits that you are basically ignoring).
3. If you ran the above classification you could create a segment where any value of “tights” in the classification causes that to be included in the segment. This solves the problem of deduplicating visits, but means you may end up with a large number of segments, which will be difficult to manage (but if you use Discover/Ad Hoc then it might make the reporting ok)
4. In the SEO world we want to ensure that there is only one version of every page, so we assign each object a primary classification for things like the url. So for example Leggings would only be trousers and not tights. A real world example of this was a retailer I worked with who had ‘womenswear’ and ‘lingerie’ as two different primary classifications and there were constant arguments over what counted in each section (are bikinis ‘womenswear’ or ‘lingerie’ for example). This means your classifications are easier, but you won’t get that nuance.
There are two other options I didn’t mention earlier:
5. Use a list evar to start with. These need to be enabled on your account – but if you wanted to you could pass through the comma separated values as part of the tag (this may have a cost associated with it). These work in the same way as normal evars, but pass through several values at once (so you would say list1=”leggings, tights”). There are limitation on what you can do with list evars though, so unless you are using them stand alone I wouldn’t recommend
6. Send each value you’d have as a separate server calls to an existing evar (you can send a secondary server call to Omniture on a page easily so that it doesn’t count as another page view – a bit like link tracking). You’d then tell Omniture that evar1=Leggings, evar2=trousers in one server call and evar1=Leggings, evar2=tights in another, so that you have both values of evar2 in your report.
HTH!
Cheers,
Alec