Measuring your SEO efforts
Right, it occurred to me that my last post was particularly dull. As pointed out by a couple of people on Twitter when I couldn’t work out whether I’d posted it correctly or not (thanks again guys). So this one is going to be more interesting insightful. Actually this week is going to be a post on how you measure your SEO efforts effectively, which is always a hot topic. Just out of interest, I’m not going to talk about how to create your SEO strategy or how to create and use your keyword footprint. These should be things that you are aiming to do through use of competitor intelligence tools (cf Hitwise) as well as your content stance and your keyword analysis from your web analytics tool (external and internal if you have one).
In fact, it surprised me a little bit that I’d never talk about this before. I suppose there are a few things that so many people have written about that you think you don’t need to put them in. Lets start at the top:
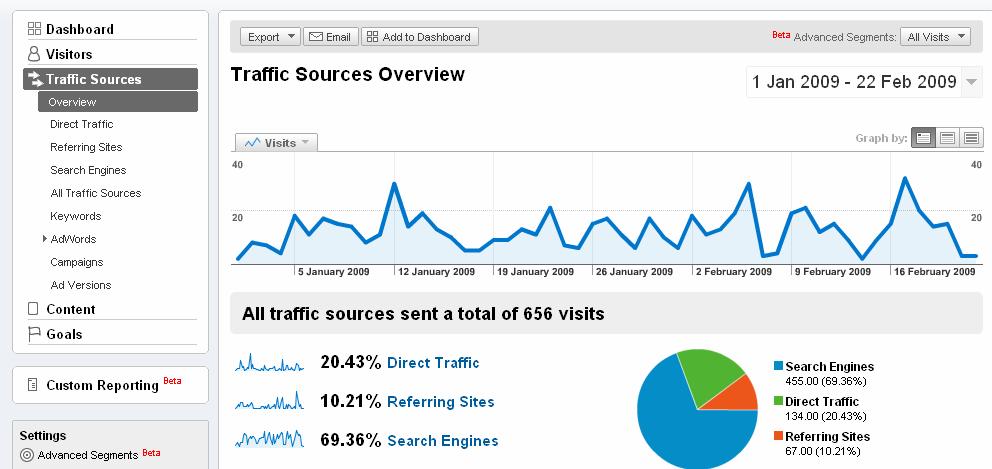
Measure your visits from search engines via organic search
Duh. Of course you do. Go to your Traffic sources report in Google Analytics and there it is. It even tells you the percentage from search. Brilliant. Make sure you don’t include your paid search to start with though.

This is easier in some web analytics solutions than others. Obviously Google make it easier for you to find in their tool, because, well, it’s what they do.
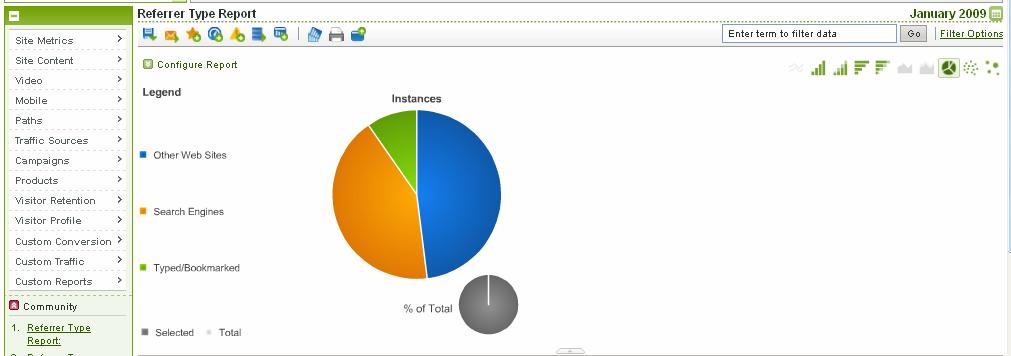
In SiteCatalyst, you still have a similar report in your ‘Referrer Type’ report. Again, this is going to be a bit misleading if you don’t have the visits metric turned on and are using the ‘instance’ metric, but hey – lets get over that. Bear in mind here that you are including your paid search traffic too. Really you want to be looking in your Search Engines – Natural or Search Keywords – Natural reports. Remember that if you don’t have visits turned on, you should be comparing like with like and comparing your ‘Searches’ metric with your total instances metric on your referring domains.
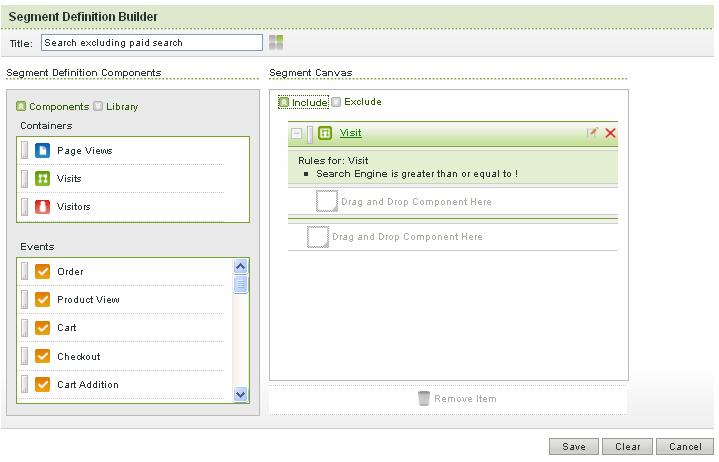
Measure your visits from search engines via organic search minus Brand Traffic
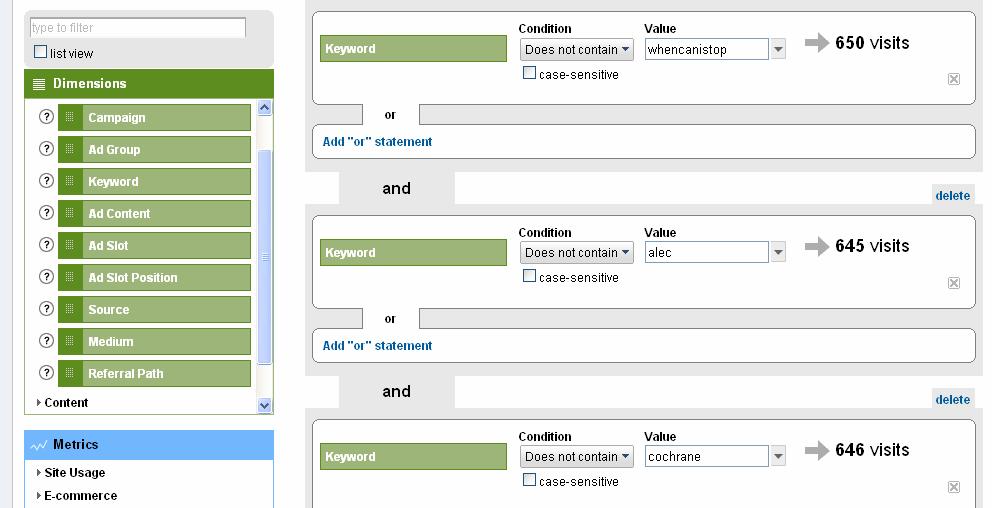
This is a bit leftfield. You should be getting your brand traffic to your site anyway. You’ll rank number one for your brand name, your product names etc (you should do anyway). What you want to know is how you are doing for the rest of those search terms. This is where the analysis gets quite tricky, but not impossible. In Google, the easiest way is probably to create a custom segment:
In SiteCatalyst this should be easier to do due to your ‘filter options’ in the top right hand corner which allows you to exclude terms very easily.
Measure your conversions from search engines
This sounds fairly obvious, but not always. You don’t want just visits, you want your visits to convert as well. Remember that segment you just created in Google Analytics? Well fortunately you can now use that segment on your ‘goal conversion’ report as well. In SiteCatalyst it is all a bit easier, because you can just change your metrics to your conversion tags (keeping in place your current filter).
Measure the number of unique search terms and unique entry pages
Wow – here is a bit of a new metric. What you are essentially saying here is that you want to increase your keywords to as many search terms as possible (assuming that they all convert) and that you want your entry pages to be equal to the number of pages that you want your users to arrive at. Theoretically speaking, if you have pages that are indexed in the search engines, but aren’t generating traffic, it is because they are lacking the correct keywords.

These metrics are much more difficult to produce for SiteCatalyst. Why is that? SiteCatalyst doesn’t tell you by default how many unique lines it has in its database. I reckon that the easiest way of doing this is through the data warehouse. The Data warehouse is a much under utilised product. It gives you lots of tit bits of information that you probably wouldn’t be able to get normally, but more importantly it gives you the entire dataset on one page.
(Ok, just as an aside, you can probably do this just by downloading a pdf of all of your search keywords from the main keywords report in SiteCatalyst. But there is a reason for producing this anyway, which I’ll come onto in second).
To produce this report what you need to do is create a segment that includes all your search engines (Search engine is greater than or equal to !) and that excludes your paid keywords based on the campaign that defines your paid keywords (there is an exclude tab on there too). This is key because it just gets your data set to show just your natural search. This is also the mechanism for creating ASI segments, however your natural search is probably too big for an ASI and would have too much processing, so this is better.
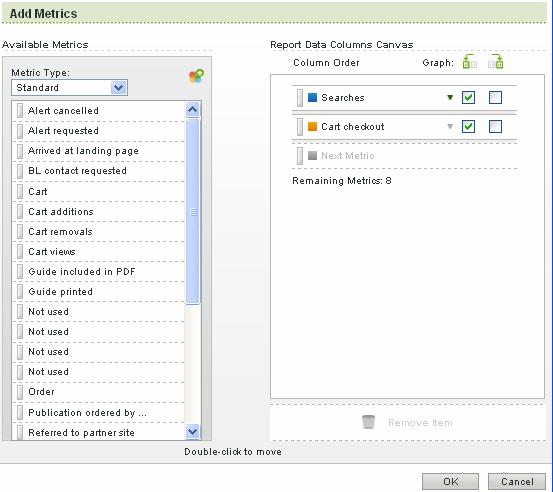
Having created your segment, you are ready to build your report. You will probably want to do two of these. The first one will be ‘search keywords – all’ and visits. These both appear in your ‘standard’ Items. The second report you’ll want to run (with just the segment you’ve created earlier) are the ‘entry page’ and visits. This will give you your two metrics as before.
If you are running your search term analysis at the same time as producing this report, it might be wise to add in your conversion (or engagement) metrics into this report to save yourself (and Omniture) a little processing time. Remember this report we are looking at will view your overall strategy. If you are trying to establish your keyword strategy and increase conversion for each keyword, you’ll need to see the conversions for each keyword and this is an ideal way of doing it.
Measure the technical aspects of your content
This isn’t so much a visit based set of metrics, but is vitally important none the less. You should know how many pages you have available to index (if you’re a content site you could try getting this from your database, else you could try the CMS). You should also know how many pages Google has indexed from your site (here are the ones from this blog). Ideally these figures should be as close as possible. Remember this isn’t a competition to see how many pages you can get indexed. Ideally each set of content should only appear once (I know that the search engines have been talking about the canonical link parameter that you can put in your header to avoid duplicate content, but you should still try and have one url per bit of content).
Why stop with Google though – remember you get traffic from Yahoo, MSN (and Live), Ask, etc. Make sure you are not throwing too many pages at them (or sometimes more importantly, too few).
This also makes it interesting when you compare this figure with the number of unique pages that search users are entering the site at. It’s all well and good having 5 million pages indexed in Google, but if on an average month you only have users arriving at 500,000, then you need to work out how you are going to optimise the other 4.5million. This can help drive your strategy (should I be creating more content, optimising the current content better or re-evaluating my keyword footprint to get more appropriate terms).
Measure your reach
This is something that can seem not important, but I think is. When you are a blogger, you spend half your life focusing on what other people think of you. How can you get people to quote you in their blogs. You have to write comments on other people’s blogs, seed forums with your posts, put up links to it in Twitter, etc, etc (PS, DON’T SPAM). How do you measure the effectiveness of this?
Well there are two thinks you can do. You can use the ‘link:’ parameter in your favourite search engine (mine is Yahoo Site Explorer). Every month if you see an increase, this is because more people are linking to you. Also you want to check out your Technorati ranking. This is a measure of how many other blogs have linked to you and their relative importance. Mine is quite low, but then my content is quite niche and long tail (plus I don’t write often enough).
What do you reckon? Have I missed anything out? (please don’t say page rank :))
This wasn’t boring at all! I’m having to learn SiteCatalyst very fast at present and I found this very useful.
I don’t much like YSE for measuring inbound links (they count everything, and you get information overload), but I don’t like the link operator search in Google either, which under-reports to such an extent that it is basically worthless.
Google will give you better link data for your site via Webmaster Tools, which I’d recommend. I’m sure that’s stating the obvious, but you didn’t mention it 😉