Conversion Funnel Analysis in Omniture SiteCatalyst
Well last week I threatened to do it. In fact, I think I’ve threatened to do it for quite some time, so here it is. Today I am finally going to do that follow up to the conversion funnel analysis post that I keep claiming is really popular. What I thought I would do here is talk about the Omniture Fallout Reports, what you can do with them in a simplistic terms and where they don’t quite work.
Fallout Reports

Well this is where it all starts getting a bit funky. Fallout reports are the true funnel reporting ability from Omniture. These are the things that you need to use when you are in the situation where a proper funnel will actually work. But these are situations that are few and far between. The above example shows why these situations can be few and far between.
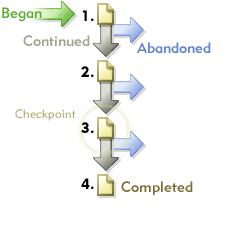
The reason for this is that these conversion funnels are actually very specific in what they describe. You have a series of visits that start at the beginning (however you define the beginning). Of those visits your looking to see how many moved on to step two in the process. Of those visits that got to step 2 your funnel will show you how many move on to the next step. And so on until you get to the end. This leaves you with a couple of rules:
Rule number 1: If your end point can be accessed without starting at the beginning then these are only going to paint part of a picture. I wouldn’t say that this will be pointless but you have to be aware that these things are only going to tell you half of what is going on.
Rule number 2: If your intermediary points are optional, then you may start losing large bits of information about how the users get to the end point.
If you don’t pass rules one or two above, then you can still do this stuff. But remember that if you fail number 1, then you need to make sure that you don’t state that these are you only conversions. A good way of looking at this is that this is a process that your users could take, but many of them didn’t, some of them started the process halfway through (or even right at the end).
If you don’t comply with rule 2, then you might need to do the reports many times – for each of the routes that your users can take through the site. Alternatively, you can go down the route that I prefer of only including common steps down the process (although I’m not saying that is right in all situations!).
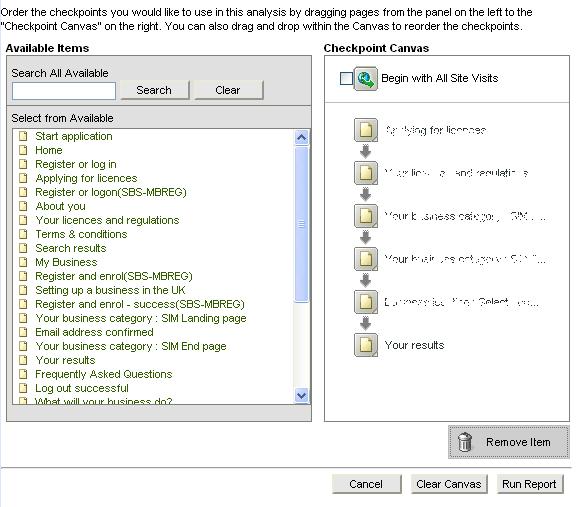
Right, so how do you do it? Well it is remarkably simple. You go to the fallout report in your pathing reports and select Fallout. The difficult bit is choosing the pages that you want included in the report. Then you can just drag and drop them into place:
Once you have chosen your pages, it will give you a report that looks a little something like this:
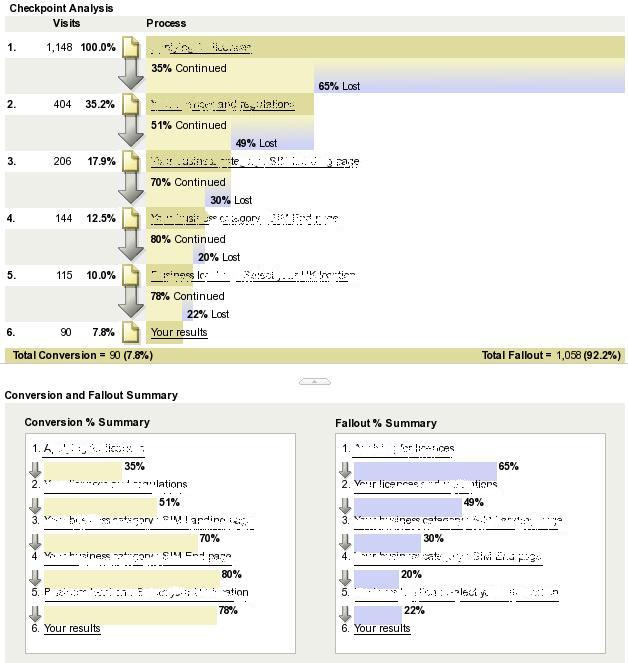
This will give you a really good impression of where people are dropping out of your process. The real question is, what the hell do you do with it? Well first things first is that you should look at the places with the maximum drop offs and come up with some ways of making them smaller so that more people get more people carrying on with the process. How do you do that? Well this is where you can do some A/B Testing if you have some ideas about what to do. Alternatively you could do some usability testing and ask your users what is wrong with the process either in the form of a focus group or you could set up some onsite surveys.
What can you do with these in the long term? Well firstly you need to use them to measure the effects of the changes that you make. Don’t forget to make small changes frequently, so that you can measure the effect of each of them individually.
Alternatively you may find yourself breaking rule number two above and have a split in your process causing two discrete user journeys. What you can then do is use this process to breakdown your total conversions by each of the different routes:

You can then use this to show very comprehensively that your problem is step 2b as the point where most of the drop outs. This of course becomes increasingly complicated as you end up with more and more routes through each of the sections. What you need to do as an analyst is work out where the most important points are. There is no point going into great levels of detail on a route where you know most of the people drop out on the generic places.
Another situation that frequently arises when I talk to people about funnels for processes are occasions where we’ve artificially built a funnel for pages that are freely available without using the process. A good example from past jobs for this are job application processes. We would artificially create routes for the user to get through to the job posting, when they frequently would be able to get to the posting from outside the website without going through our process.
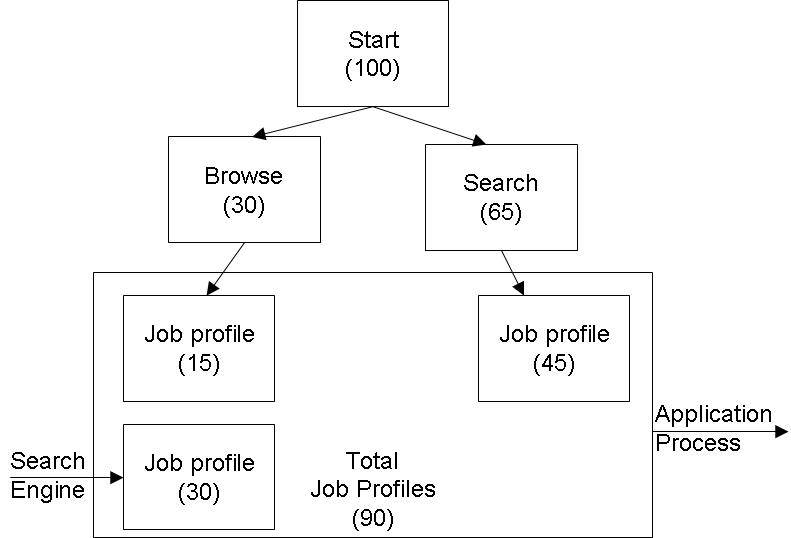
In these cases it is frequently much more effective if you can openly demonstrate where each of the views of the process are coming from and your fallout report can be very useful. You can take your visits who go through the search process to find a job, those that take the option of going through the browse process and add them together with your users who come from outside the site to get the total visits. This can give you some information about where to be prioritising your efforts. In the case above we notice that our ‘search’ process seems to work quite well (45 out of 65) whereas our browse process not so good (15 out of 30). However we can always do some stuff to try and get more visits from search engines.
Full Path and PathFinder
Two additional reports that you have possibly encountered in Omniture are Full Path reports and PathFinder reports.
The Full Path is an interesting report. It shows you every single path that every single user took through the site. Basically it is the data that fuels the Fallout report. On its own it doesn’t often provide that much detail that you can actually do anything with. Go and have a look at it. A trainer that I had for Omniture told us that on every training course he bets someone that the most common path that any user will take through the site is that they’ll visits the home page and then leave immediately. Someone was foolish enough to take him up on the bet for us.
The PathFinder is a sub set of the Full Path report and slightly more useful. what this will allow you to do is give you a sub set of you full path reports. The advantage of this is that you can group a few pages together so that you can work out if your users are taking particular journeys through your site. These should be of four pages or fewer, though. These can be useful in situations where you think that users are moving backwards and forwards in your site.
The other useful thing you can use these reports for is that when you want to segment your next page report by a particular previous page. You can then use your pathfinder report showing your previous page and your current page with a wildcard as the third page to show how those users are moving through the site. This is very useful when your current page has two (or three) major sources to it and you can’t quite work out how the next segments work in terms of the scent.
So these funnels don’t quite look as funky as the things that I produced last time, but I’m hoping that I’ve given a few examples of situations where you can use the Fallout reports.
Leave a Reply