5 simple tricks to work out why your traffic has gone up
Ok, last week I talked about why January was great for traffic, but you can’t just leave it there. I finished the post with a comment saying that you need to find out why users are using the site more and what they are doing. This week I’ll give you my top 5 tips on how to work out what your users are doing on the site and why it is performing well. These will be your first port of call every week when you look at what is going on with your website.
Tip 1 – look at where they came in
Don’t forget that your whole process is a top to bottom thing. Step one is to look at where your users came into the site to. This may not be as easy as it sounds, but in any common Analytics tool you’ll have a report that is either called top Entry pages (in HBX for example). Or it is called top landing pages (as is it in Google Analytics).
Lets be straight about this now – your top entry page (landing page, whatever you want to call it) is probably going to be your home page. That is probably going to be fairly static in terms of traffic (unless you are doing big brand advertising on the telly or the radio). You don’t really send any of your campaigns to the home page any more (they all arrive at nice bespoke landing pages).
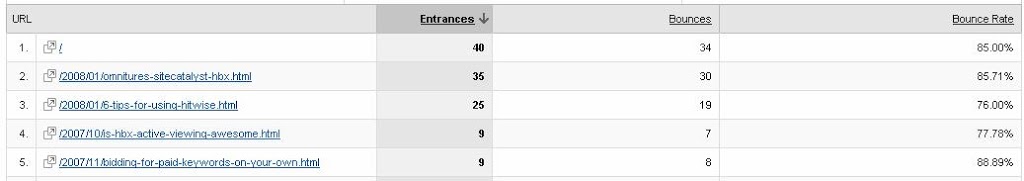
Here are my top 5 landing pages for this blog. The top one is the home page. The second one almost has as many, but that isn’t surprising because it was quite an important event.
 Woah, Woah, Woah, Alec. The second one being an important event doesn’t mean that it will just automatically generate traffic.
Tip 2 – look at where they came in from
There’s definitely two parts to this. Let’s look firstly at our individual pages:
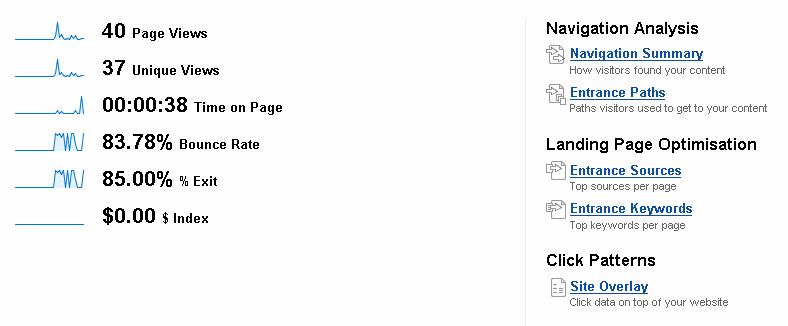
Your page (home page or other) has lots of traffic arriving at it. Where has it arrived from? This is usually really simple to do in web analytics tools. In Google Analytics you need to drill down to your page and then there is a big link on the right hand side that says ‘Entrance Sources’:
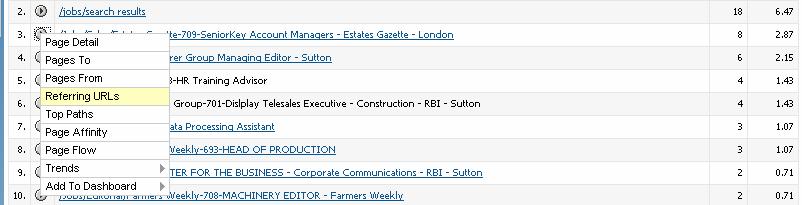
In HBX, it’s just as easy – you can be in any of your pages reports – top entry pages, Most visited pages. My favourite is the ‘Page Analysis’ screen because from here you can look at all of your metrics in one go – Visits, Visitors, Entries, Exits and Single Access. All you need to do get the referring urls is to click on that infamous grey arrow and then referring URLs:
Once you’ve seen your landing pages and you know where the users have come from to get to them you should be able to get a better impression of what you need to do to those pages (why did the user click through from this site to my site and what did they want to achieve when they got to that page). Each landing page/referring page combination is unique, you need to set the landing pages (and build your links) to make that work best.
Tip 3 – look at where they came in from (macro)
We’ve gone micro here, but lets go back out to the macro level. What do I mean by that? I mean two things:
Look firstly at your whole site. In Google do your ‘All traffic sources’ and in HBX do your ‘top referring domains’. These will tell you where your traffic is arriving from generally. It’ll probably be Bookmarks and directly referred urls number one. This is your brand traffic – those you have got to type in your url, those that have signed up for email (don’t spam!!!) and those that have signed up to RSS. Then look at the rest of the sites – there’ll be some there that you weren’t expecting, so go and have a look at the site and find out why. Drill down to the urls, and get onto their site. Get into the mind of your user.
Secondly look at your content groups. This is more difficult and requires a bit of manipulation. For those of your with report builder it is really easy because you can specify your content group as a filter when you cross-reference to your top referring domains. If your content is set up well, this will allow you to split those pages designed as landing pages, the home pages, the other pages, however you want to split them. If your a commerce site, you’ve probably set up a segment relating to your conversions, so you can even look at this report within that segment to see if you are converting.
Tip 4 – look at where they came in (macro)
Well having looked at where they came in from on a micro level, where they arrived from on a micro and macro level, the obvious upshot is to look at where they cam in on a macro level. The advantages of setting up good content groups in HBX will be apparent here. Assuming your table lengths are long enough you should be able to search for your content groups in your top entry pages (you can do this too in Google Analytics if your folder structure within the site is set up ok). This will give you a nice total at the bottom that you’ll be able to see as a percentage to work out which types of content are generating the most traffic (home pages, landing pages, etc). Trend this over time and if you’re like my sites then you’ll probably notice most of the increases in traffic coming into a certain content type.
Why is that? Do you have a lot of it? Do you produce more than other types of content? Is it better? Is it more relevant? Have you been building links to it more efficiently? These are all things to think about rather than jumping on the ‘It is better lets make more of it’ bandwagon.
Tip 5 – look at where they came from
Because I like looking at maps? Because I think I can name all the countries before I scroll over? Quite possibly both these things, but there is a more important issue here. You’ll get such a better impression of what is going on. Are they US? Are they UK? In the case of my blog – do the people in Spain, Canada, Germany want to know about my subject?
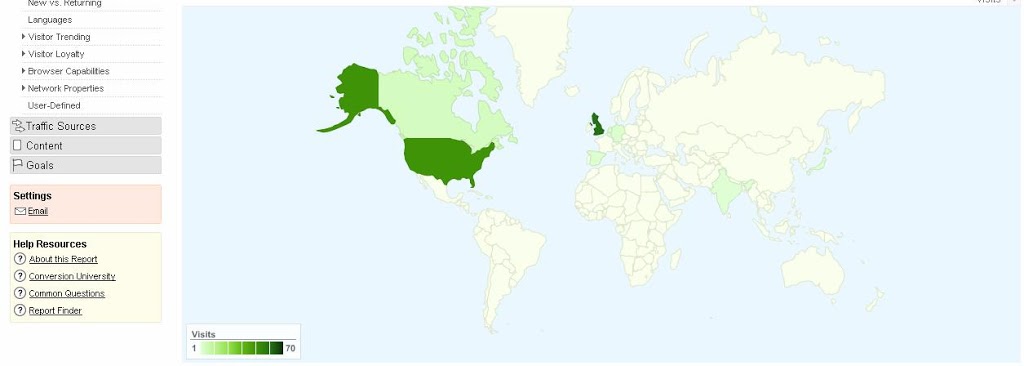
In the case of my company’s main jobs page, do the people here want to come to work in the UK from Zambia, Latvia or the UAE?

Leave a Reply