Happy 5th Birthday Whencanistop!
Every year I produce a blog post pointing out how brilliant I am at blogging and this is that occasion this year. That’s right, I’m congratulating myself on my ability to write a blog for five whole years. You know what? Blogging is hard. That’s right, I’ve said it. I put a lot of hard work into this blog on a regular basis and that gives me the right to congratulate myself on a yearly basis and if you don’t like it, tough. This blog post is about me.

- Conversion Funnel Analysis: When, How and What – February 2008 (1,942 visits)
- New Omniture SiteCatalyst Dashboards – April 2010 (1,697 visits)
- Learning to use SiteCatalyst – January 2009 (1,537 visits)
- Conversion Funnel Analysis in Omniture – May 2010 (1,470 visits)
- What Adobe should do for SiteCatalyst version 15 – October 2010 (1,145 visits)
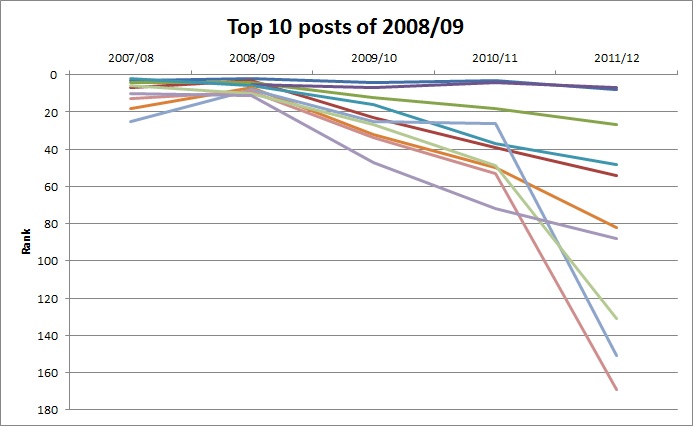
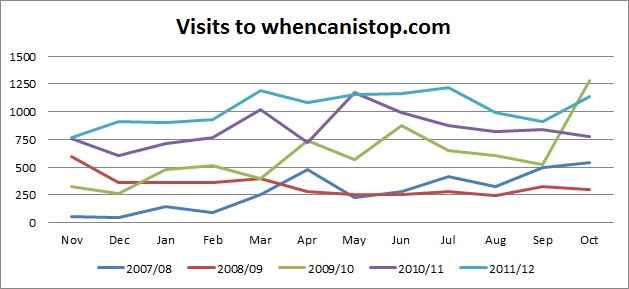
The next year was even worse! Only one of the posts that were in the top ten in 2008/09 wasn’t written in the 2007/08 period! That graph at the top where you see 2008/09 traffic shows that things didn’t go to well. Bizarrely that post that was new in this year’s rankings (learning to use SiteCatalyst) has been in the top 10 of every subsequent year and is now the third most viewed post of all time!
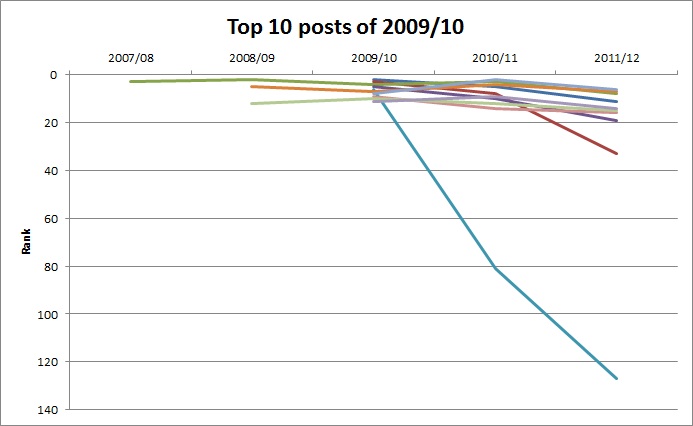
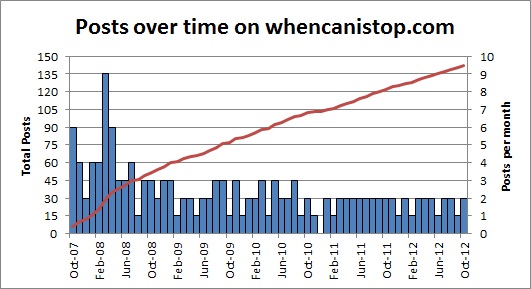
In 2009 things were much better, I wrote a lot of posts that got visits. Seven of the top ten posts of 2009/10 were written in that time period and only three of them were written in previous years! This really was the golden age of whencanistop. Three of the top five of the overall top posts were written in 2009/10 and October 2010 is still the most visited month of the year.
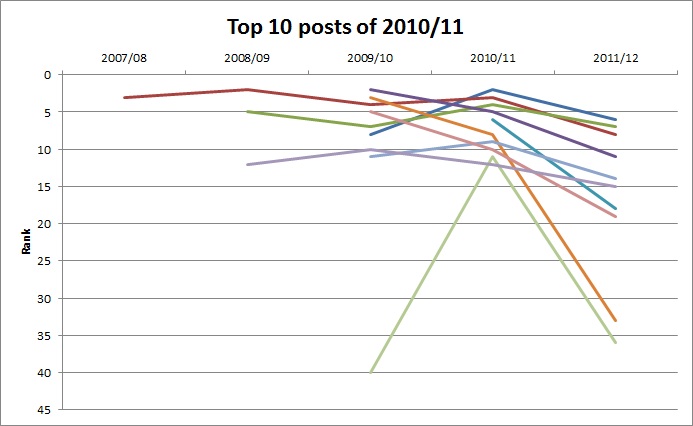
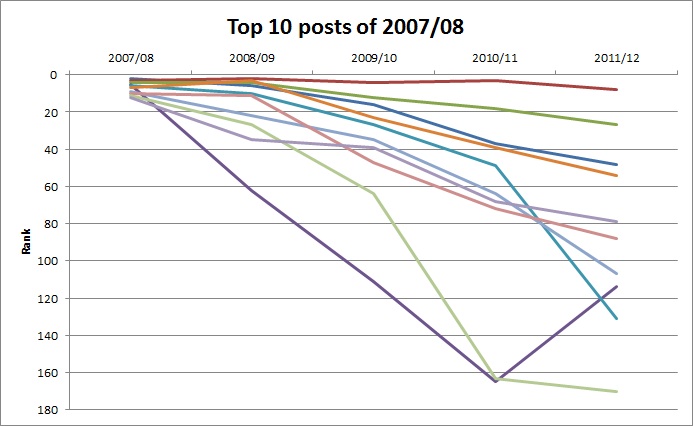
2010/11 was a different matter again, only one of the top ten posts was written in that year. One of the most viewed posts (EU cookie laws verified) was written in July 2010, but only gained traction towards the end of the year due to a link in an eConsultancy article I guest wrote. But on the flip side, the scale of my left hand menu shows that out of the top ten posts, all of them were still in the top 40 the following year.
So what about the last year – where do they rank in the most visited posts of 2011/12?

Well this is difficult to graph because posts that were new to 2011/12 only have one point and hence you can’t see a line. So if you break it down – one post was written in 2007/08, one in 2008/09, two in 2009/10, three in 2010/11 and three in 2011/12. That’s quite a result. The fruits of my last five years are all still showing in the data as you guys are still reading the posts.
So finally I thought I’d show you how my visits to posts breaks down by the year that the post was written:
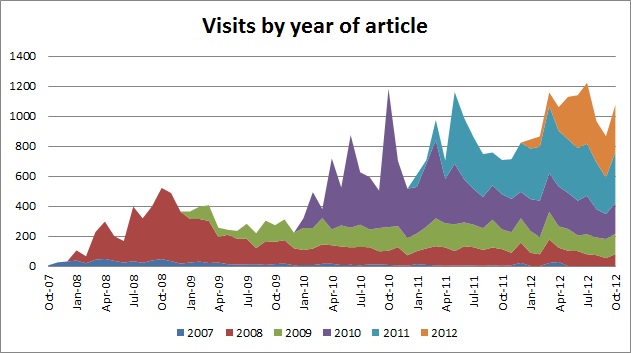
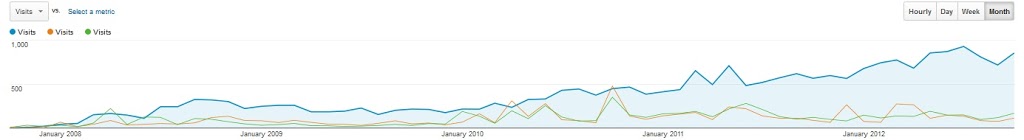
Now you can get an impression of why the traffic to this site has grown over the last twelve months. I write a series of posts that gets more visits, whilst the previous posts continue to gain visits by being indexed in search engines. This effectively justifies my decision to make longer blog posts as opposed to shorter ones. Long may it continue.