There is lots of data to analyse despite Google’s Secure Search update
A lot has been written recently about the introduction of Google secure search means for websites. In fact, I’ve been at the fore of writing about it myself on the Digital Transparency blog that I’ve been contributing to recently, so I know all about the subject. Well, I know a little bit about it, which is what I’m going to share with you now.
In case you’ve missed the memo, Google recently changed the way that it did search quite drastically. They now make it so that if you are logged in to one of their products then your search will be done through a secure environment. You may remember that when Google plus first came out I theorised that they were going to use it to make search more personalised based on what sort of stuff you have plus oned. I still think this will happen, but the first thing that Google needed to do was obfuscate the url in the search bar, as this is the way that they are going to make it personal. If you put it in the url then you decrease the security for the user because this information gets passed over when you click on a link. They obfuscated it by making it so that the referrer doesn’t have a search term associated with it at all.
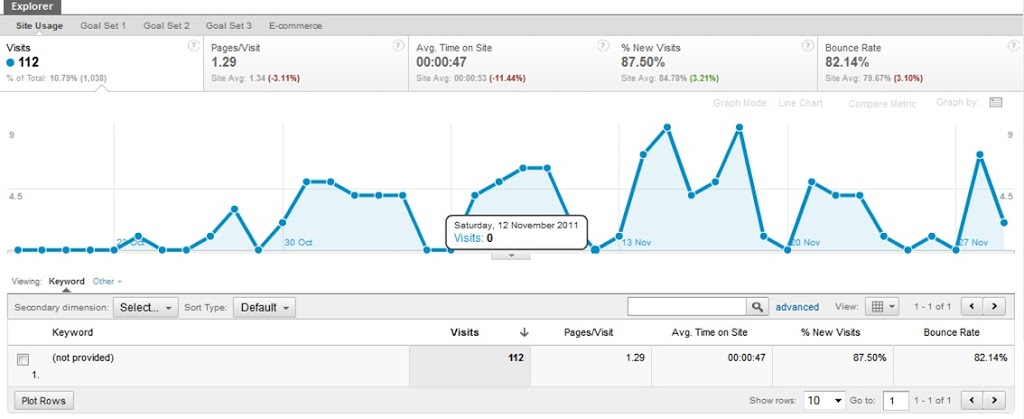
So what does it mean? Well it means that in Google Analytics you now have (not provided) as a search term and in SiteCatalyst you have Keyword Unavailable.

In fact if you look at the graph above, it is quite a lot of visits that it is providing – up to 10% of the search visits for this blog, but many others are seeing more and it does really depend on your audience. My audience is slightly more technical (I think!) and more likely to be logged in to something like Google Plus or Gmail than ‘average’ audiences. But remember that no audience is average and the figures you are going to get will vary.
As Avinash Kaushik points out in his blog post on the subject – there is a wealth of information that you can find out about the (not provided) data in Google Analytics. In fact there is a wealth of information that you can find out about the visits from all your tools. You can find out exactly the same set of information about the visits as you would be able to from any other segment of visits.
Of course one of the points that Avinash makes is that it seems like it is a large value because it appears near the top of your keyword list, but it isn’t actually because it is comprised of lots of small keywords. It is worth remembering though that this data could be slightly biased because of the segment of the users. This is called ‘sample bias‘ and is something that you should all know about.
Of course this isn’t the information that we want from the data. We want the original stuff back. Analysing it in this manner is useful, but it is only providing a bit of detail that we knew we could get anyway.
Given that we’re not going to get the original stuff back, what else can we do? We can still use the data that we have to continue doing conversion analysis (with the data bias assumed) as Avinash says. We can do it for the terms that we have and we can do it for those that we don’t have.
What we can do is start looking at how we combine together some different data sets. A recent change to the way that Google Analytics works was an introduction of some of the web master tools reports. You may be sitting there and thinking ‘So what’ at this point, because this is data that you already had, but this isn’t quite true. In webmaster tools you only get one months historical data, whereas in Google Analytics it will be for as long as your connection has been set up.
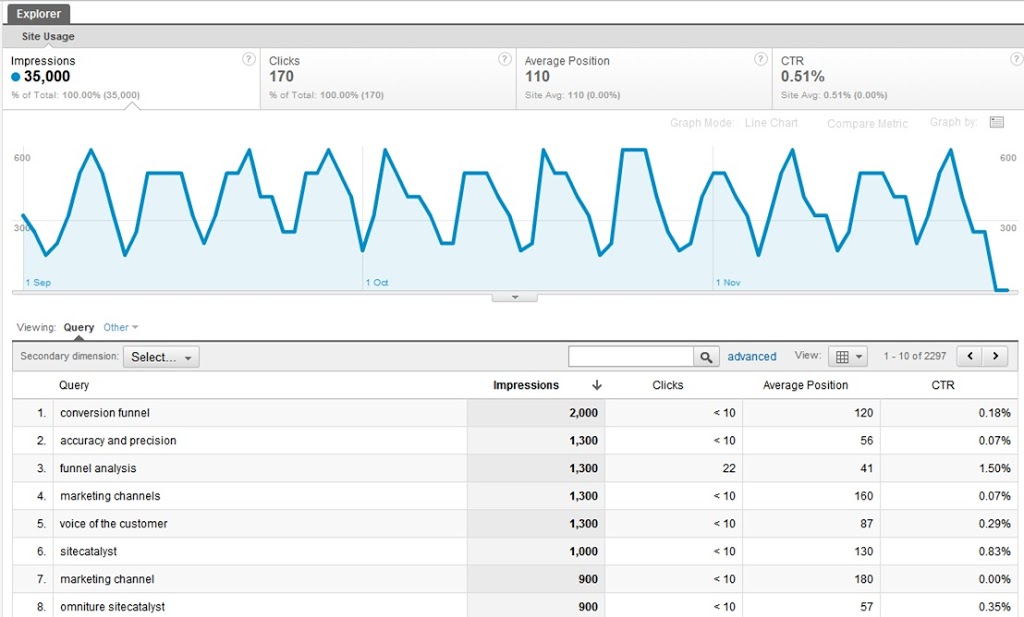
This much longer data set means that you can compare it to your visits in a much more efficient manner. For example I can see here that the number of queries that my search terms appear in doesn’t seem to have gone down recently, despite a small dip in the number of visits from searches.
The other advantage of this is that you can filter the reports by your search terms as well to produce some graphs showing the data for just a sub set. You can try to improve for a particular search term and then see how often you appear in results because of that. You can also see the effect of news or changes in search popularity.
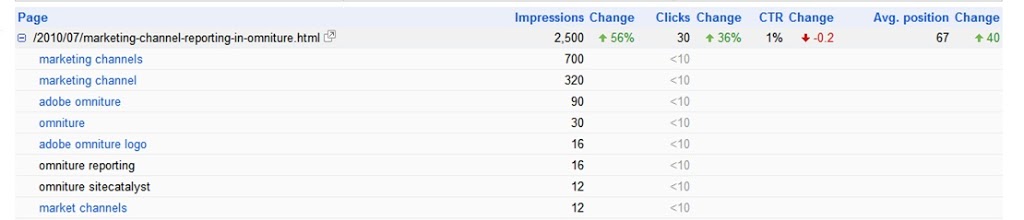
The advantage of these reports is that I can quite handily also look at not just keywords, but also of the pages and how often they appear. This can provide me useful information on which types of story are generating search terms over a period of time. Those that are doing well can have more posts written about them and vice versa. This is useful when writing new posts – I can tell if they are gaining traction in search engines or not. My last post on Conversion Funnel Analysis in Google Analytics didn’t seem to be getting much search traffic to start with, but I can see with this report that it is starting to appear in search queries now.
But of course you shouldn’t treat these reports in isolation. What search terms are generating queries to a certain page? Well Google Analytics has hit its limits here, but you can go back into your webmaster tools and start looking at that data too. This has the ability to break the search phrases down by page or vice versa (over a smaller time period):