Google Analytics v Microsoft Adcenter Analytics – Gatineau
I was going to write this post yesterday, but Microsoft Adcenter Analytics was down, so I decided to postpone it until today. Actually, this one has been brewing in the pipeline ever since I decided that I was going to put Microsoft Adcenter Analytics on my blog. Here I am going to do a bit of analysis and show you the main differences between Google Analytics and Adcenter Analytics (Gatineau). Specifically I want to look at differences in data quality.
I think the first thing to point out is that one bit of code sits immediately before the other one. Have a look at the source of this page. Go on. Right click and select view source. You see almost at the bottom of the page that there is the Google Analytics code followed immediately by Microsoft’s code. One immediately above the other and hence there shouldn’t be any discrepancy in terms of one having time to load and the other not.
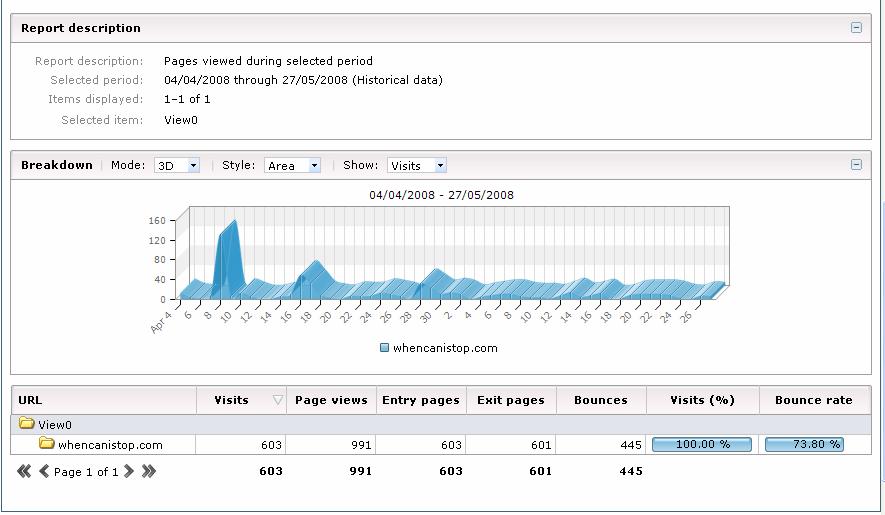
Lets start by setting the date range. I put it on the site on the 3rd April, so lets choose to look between the 4th April and 27th May (yesterday). And lets start at the top and look at how many visits and page impressions there were:

And here we have the same stats in Google Analytics below:
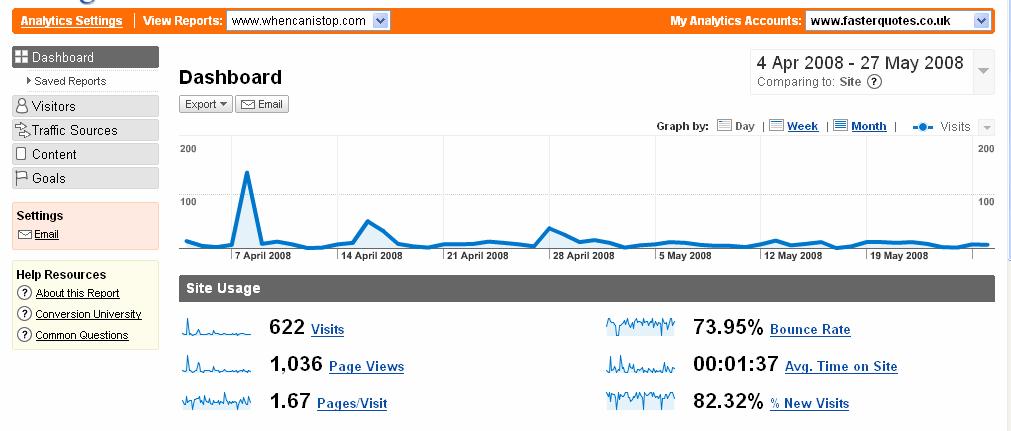
So Google is telling me that I have 1,036 page impressions, whereas Microsoft is telling me that I have only 991. That is only 4% difference. I don’t think we can be too worried about that, can we? Similarly we have a 3% difference in the number of visits that we have to the site.
Lets go down a bit more of a step then instead. Below is a table showing my top content sections for this blog. I am willing to admit that the ‘unique page views’ that Google Analytics gives may not relate in real terms to ‘visits’ that Microsoft Analytics gives. The ‘unique page views’ seems to just be a summation of all of each pages visits. This is why Google Analytics is giving me such large figures for visits compared to Microsoft Analytics.


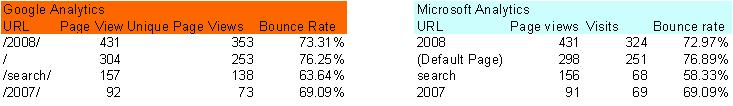
That actually brings me on to a very good point. Which of these is the better metric? Surely visits to a certain section would be far more useful than knowing how many unique page views there had been. Why would Google put this figure in at all – it doesn’t actually help me at all as far as I can see apart from misleading me. I know my site structure is fairly poor, but say for example I had my site set up in, for example, /jobs as one folder and /articles as another. We know that people look at more jobs pages on average than article pages, so this would just indicate that my /jobs section was more popular. In this instance I think the content hierarchy works much better in MS Analytics.
Having said that, the layout for GA is much better for content. If I want to look at most viewed pages in GA, it is one report. If I want to look at most viewed pages in MS analytics then I have to look at the tree map page and see if I can work out what is going on (the other route just allows you to drill down in sections). Actually each of the pages themselves are all very similar

Next we want to look at the referrers to the site. And this is where the two systems differ, although there is a reason. The reason is that, according to Google I had 118 visits coming from stumbleupon. I’ve talked about Stumbleupon before on this blog (hey – don’t forget to give me the thumbs up!!!), but it was interesting how Google and Microsoft dealt with this referrer in different ways. In theory the person doesn’t come from stumbleupon (they click on stumble in the browser and arrive at your page), but they do have stumbleupon as their referrer. Google Decided to put this in as a referrer, whereas Microsoft decided that this was only ‘Direct Traffic’. Interesting comparison.
The other thing I like about Microsoft is that it gives you a breakdown of the location of your search engines:

Especially given that quite a lot of traffic is starting to come from blog search, news search, image search. Microsoft also gives you the breakdown of which traffic is coming from Google home pages, mail pages, etc. Unfortunately it doesn’t have easy access to a break down of search terms, which is a tad annoying. It does have the tree map view that I commented on last time to give you all your keywords, mind you.
Two final points about Microsoft Analytics (for the moment) is that the figures they were giving me for unique users were a load of gobbledygook (they were in the thousands – far more than page impressions and visits). I’m suggesting there is probably a bug in there somewhere that will be fixed soon. Also they don’t have an export function yet (still in beta) so you can’t export any of this into excel (or even send it by mail). These would be nice to have features.
Very good review and comparison. Nice to see explained the way Google and MS Analytics treat their visitor numbers sifferently.