Setting up Dashboards in HBX
Ok, I’m not going to moan that I didn’t get told that HBX could do this as soon as they pushed it into their live system. No really. I’m not even going to moan that I had to work it by myself and this was something that we’d wanted for a while now. This however is going to be picture friendly, link free zone. Well ok, I might give you a link to a nice website that knew about this before I did (why the hell didn’t he tell me, etc, etc).
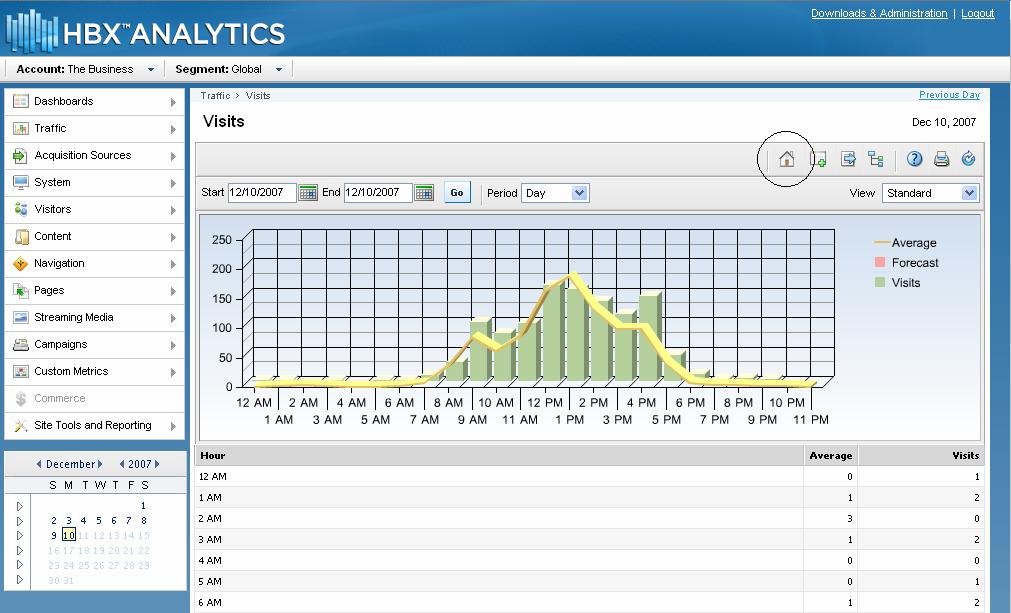
Right – HBX has some nice new features that incorporate Dashboards and homepages. We’ll deal with home pages first because it’s easier and quicker. Most of your HBX pages now have a little icon in the top right hand corner that looks like a house.

What can you do with this little home button is very clever (ok a little bit cleverer than not having it) – you click on it and it gives you two options. You can either go back to your homepage (standardised as the one that shows you the visits throughout your time period) or you can set your current report as your home page. This means that you can choose any one of the reports to have as the first page that you log into. Especially useful if you always look at one of the other pages first or if you have set up your dashboards to be useful.
The old dashboards in HBX tended to be rubbish. Well they did in my opinion – you might have been able to find useful ways of using them. One of the nice new updates that we have in HBX 4.1 is that you can now use search facilities in HBX dashboard creation. So in the past when you wanted to see a list of the most popular pages, you discovered that the home page, search page, other various navigation pages were always at the top (and not the articles – hey, I work for a media website). Now you can filter them to get rid of these pages. And if you’ve been sensible like we have and named the pages with a good content hierarchy, then you can search just for your little section.
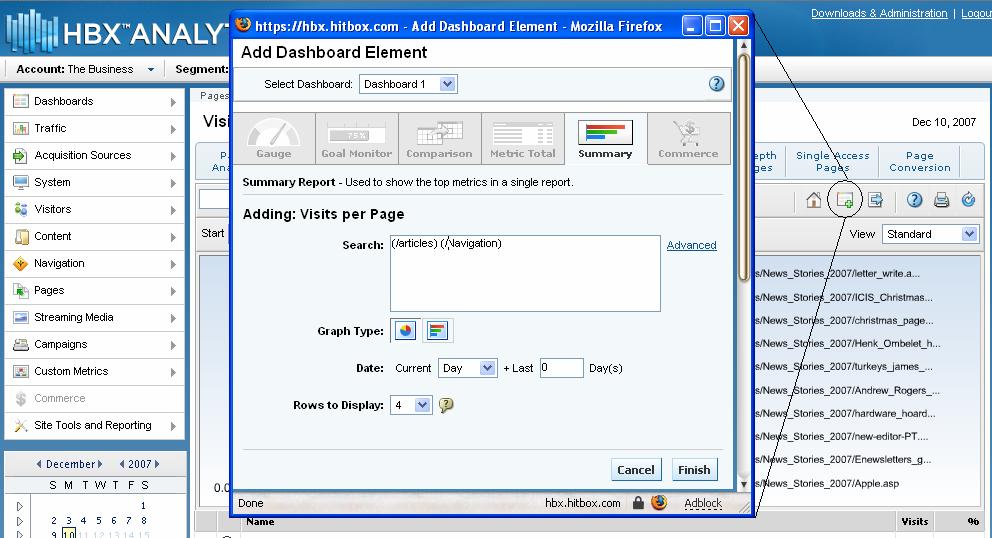
Don’t forget that Dashboard 1 already has a load of stuff in it already. Choose one of the other 9 if I were you. Don’t forget that if you choose to add a whole dashboard in then you’ll only be allowed a maximum of the top 10. However it’ll then have a nice link into your whole report with that filter still applied. Wow – that means that instead of creating bookmarks to all of your top reports, you can put them in a dashboard and suddenly you can right click and put them in a new tab of your browser, really easily.
Don’t forget that there are those other dashboard types you can add, eg for individual entries in some of those reports like below if you want to get a certain amount of traffic from a domain:
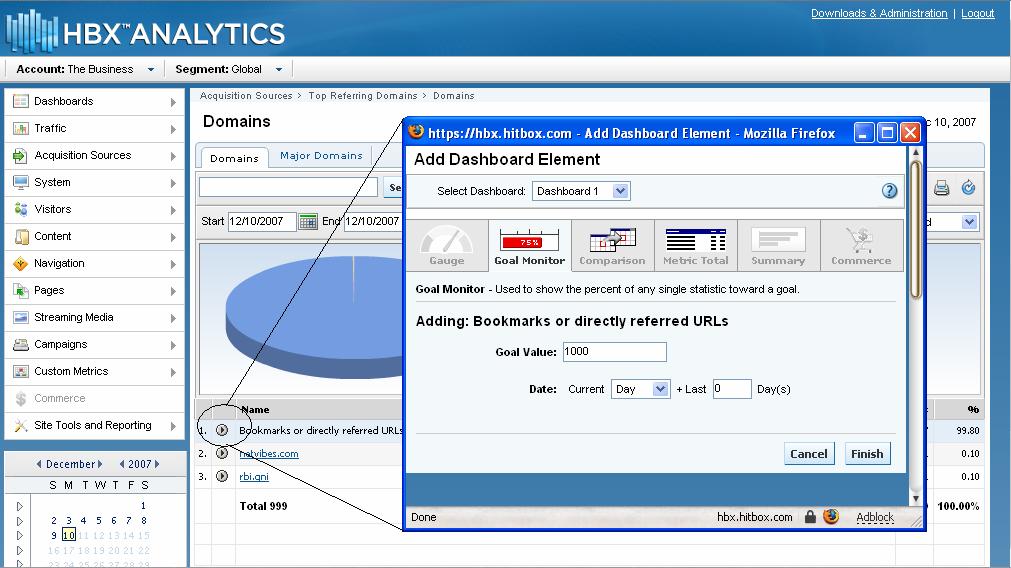 I think journalists/editors might want to use these if they are trying to hit their targets for visits to their stories (using the custom metrics we’ve set up). We can also use the gauges for conversion points (for those of you setting up campaigns):
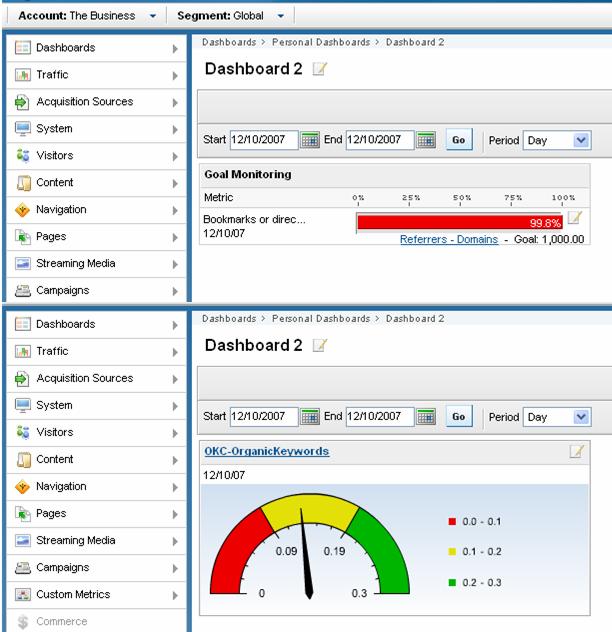
Ok – now you can see up at the top there next to where it says Dashboard 2, there is a little picture of a piece of paper and a pen (or is that just my imagination). Click on this and suddenly you have a whole new set up of options of things to do.
First thing to do is to change the name of your dashboard to something relevant. This is important if you are going to share your dashboard with someone else (or with other people generally). Now what you need to do is to move your bits of dashboard around so that they are in the right positions. This is much easier than with the old version where you had to cancel them and start again making sure they were in the right order. Now you can drag and drop – like the widgets in the home page of your Google.
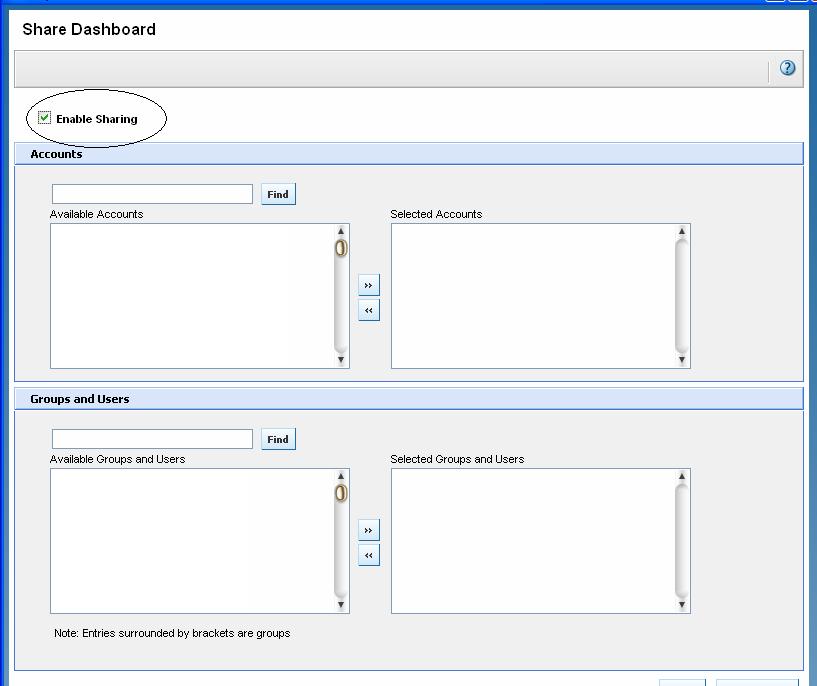
Next thing you can do is to share them with other people. This is the clever (and a bit more time consuming) bit – click on ‘share’ in the drop down next to the Dashboard name. You are then given the option to share this with any number of users for any number of sites (that you are subscribed to).
 Next thing you have to do is get your users to subscribe to them. This is really simple too – get your users to log in to HBX, click on the Dashboards link on the right hand side and then on “Subscribe to Dashboards”. You’ll then see all dashboards that you can subscribe to. You can either view it to check it’s ok – clicking on the magnifying glass on the left – or you can subscribe to it by selecting the report and clicking on subscribe.
Now all your subscribed dashboards will appear in your ‘subscribed dashboards’ sub menu of dashboards. Which you can also make as your Homepage if you want.
Good overview Alec. Thanks for mentioning my site as well.