The first 5 things you should know about SiteCatalyst
“Hi Alec, with your help we’ve just successfully put SiteCatalyst on our website. My development team say that the data is being collected so can I use it now?” says my imaginary client.
“Sure.” I say “Have you ever used SiteCatalyst before?”
“No, sorry!” comes the reply
“Ah.” Time for a rethink “But you have used a web analytics tool before, haven’t you?”
“No, sorry!” comes the reply
“Well in that case you should read my blog post on the first five things you should do in SiteCatalyst!” – I love nothing than a bit of self promotion with the clients.
“I didn’t know you’d written one!” says my erstwhile client
“I’m writing the rather convoluted introduction to it now!” I say.
1. Understand the different types of data points
There are four different types of data in SiteCatalyst and they all have rather ridiculous names:
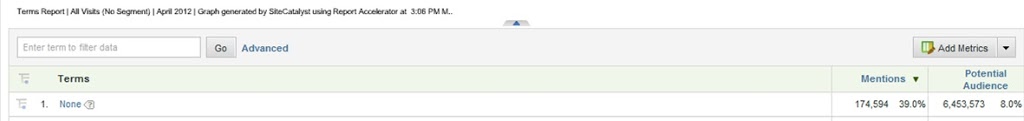
- Traffic Variables: Traffic variables allow you to set a value on each page. Want to know how many times a certain page has been viewed? Traffic Variable. Want to know how many times a banner has been viewed? Traffic Variable. Want to know what search term users typed in? Traffic variable. You have a somewhat limited list of metrics that you can use, but I’ll come on to that later.
- Conversion Variables: Conversion variables aren’t very well named. These aren’t the variables that convert, these are the things that get converted. Want to know advert people saw on your site before buying? Conversion variable. Want to know what campaign people came from before signing up to your newsletter? Conversion variable. Want to know how many product pages people viewed before requesting more information? Conversion variable.
- Events: Events are the things that convert against each of the values in your conversion variables. Events are the buying a product, signing up to the newsletter and requesting more information. You can put them wherever you want. You could put one on every page and call it Page Views (we do this sometimes).
- Product Variables: Products are the things that people bought, the newsletter that they signed up to or the information that they requested. They’re related directly to the event itself, how many of them there are and how much it cost.
2. Understand Metrics
- Page Views, Visits and Visitors. These are your staple metrics for traffic variables. Page Views tell you how many times something has happened. Visits tell you whether it happened for a user in their session or not. Visitors tell you how many people did it.
- Entries, Exits, Single Access. These metrics all relate to a visit. An entry is where it was the first time that a value was created in that variable, an exit is the last time that a value was created in that variable and single access is where only one value was created in that variable. In some variables these metrics make sense, in others they don’t. For example having an entry page, an exit page and only viewing one different type of page in a visit makes sense. Having an entry search term (the first search term the visitor does in their visit), an exit search term (the last search term a user does in their visit) and single access search terms (the only search term that a user does in their visit) doesn’t make sense.
- Instances, Searches, Events. These are your staple for conversion variables. Instances are the number of times something happens and are analogous to page views. In your external search reports the guys at Adobe have decided to rename instances as searches (to confuse you). The events, as we discussed before, convert against the variables. They don’t have to happen on the same page, but remember that you can set how long you want your conversion variables to persist for. Events will also convert against the product that they are set up for.
- Calculated Metrics. This is where it gets a bit more complicated. You can use any of the above (within reason, obviously) to create your own metrics which you can call anything you want.
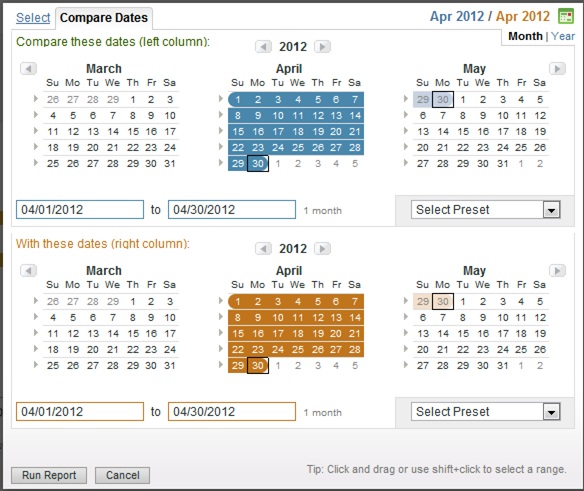
3. Comparing Dates
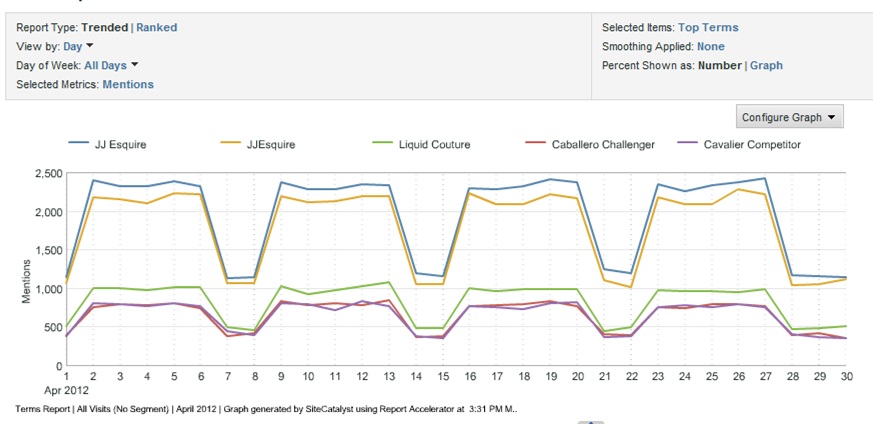
4. Do stuff with your reports

5. Sit back and bask in your glory
- Work out what you should be changing. The data will help you decide what parts of the site are working and what parts aren’t so that you can focus your efforts
- When you change something on the site, in your marketing or in your pricing you can see the effect of that change in real data
Leave a Reply