When Can I Stop
Alec Cochrane - Digital Analytics and more
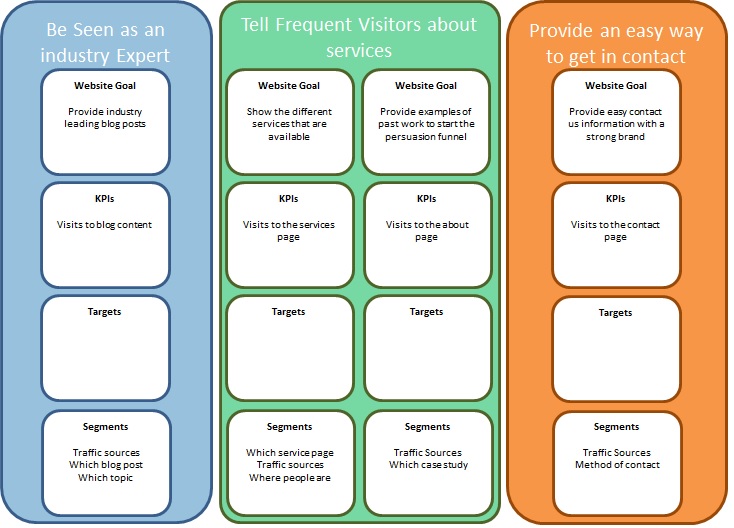
When Can I Stop is a digital analytics agency specialising measurement frameworks, analytics set up, regular reporting and actionable recommendations based on data.
When Can I Stop is a digital analytics agency specialising measurement frameworks, analytics set up, regular reporting and actionable recommendations based on data.