Going a bit left field on the blog today I thought I’d preview a tool that I have recently put on WhenCanIStop called ClickTale. This tool takes a live view of what people are doing on your website and previews it back to you in a visual way. So I thought I’d give you a quick run down of the tool, some advantages and disadvantages and any alternatives that you have using some of my data, because why not?
What is ClickTale?
ClickTale describes itself as Customer Experience Analytics. By using a bit of JavaScript at the top of the page and a bit at the bottom, ClickTale can monitor everything about how you interact with a page. This includes where you put your mouse pointer, what you click on, what you type in boxes and what part of the page was visible in the browser.
The other thing that you can do is being able to review some of the sessions of users on your page, that way you can see what they were doing in real time.
Is this data useful?
All data depends largely on what you do with it. Data in itself is not useful, but the insights that you as an analyst can take from it are useful. In this case the problem arises that the analysis is difficult because of the large amount of disparate data.
With a web analytics tool you can view a report of all of your campaigns, the responses and conversions in a nice table. With this data you have to view huge sections independently on a case by case basis. My advice is that before using this data you think closely about how you are going to use it.
Scroll Reach
This is the sort of tool that you might think is useful. Years ago I had several conversations with my colleague James Kelway of Userpathways on the subject of “Do people go below the fold.” And the answer we almost always came up with was “Yes, but…” and it was these ‘buts’ that are the interesting factor. Is your site a ‘but’? How would you know? Get a tool to monitor how much people scrolled of course.
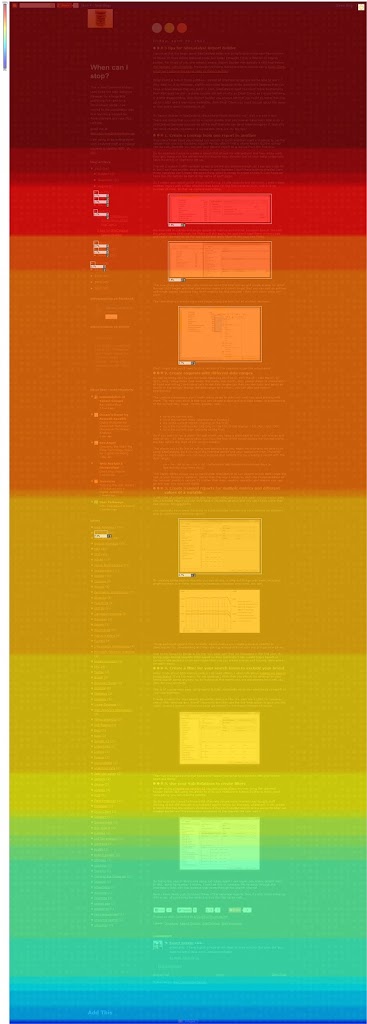
So here is a nice screen grab of my most viewed page in that time period.. As you’d expect the top of the page is dark red indicating that everyone saw it.
- The point where it goes to orange under the first image is 80% of my readership
- The point where it goes to yellow, just above the fourth image is 70% of my readership
- The point where it goes to blue, just above the seventh image is 60% of my readership
Is this good? Well one of my long standing fears has always been that people don’t read long posts and would appreciate smaller ones. This validates my position that longer posts with more images works well. There will be a continuation of this editorial policy in the future.
My blog is relatively unique in this sense though. What you want to be doing is seeing whether your users are reaching your call to action, or the benefits of buying or whatever it is that is at the bottom of the page. If they don’t you need to change something and see what happens – does it give better results?
Attention Heatmap
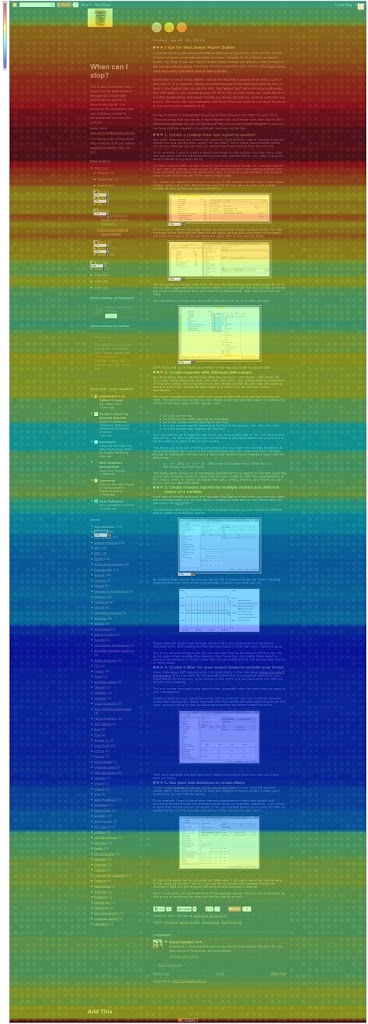
It’s interesting when you look at the attention heatmap, but I don’t think that it will go beyond that in most cases.
In this case the colouring relates to how long the users were looking at bits of the screen for. The blue bit at the bottom indicates that they are getting a bit bored by that point and are skimming through, although it is interesting that it gets a bit greener again at the end.
Personally I feel that this is one of the problems of the longer blog posts – whilst users do read them, they get a bit bored by the end. And in some cases they also relate back to the author. If you view the post in question,
5 tips for SiteCatalyst Report Builder, you’ll notice that in this case I kind of lost a bit of interest towards the end. Those first couple of tips were good, but four and five were a bit obvious and hence people skipped past them (possibly).
For you, mileage would vary with this report. What are you trying to gain from looking at how long people dwelled on parts of the content? What will you change because of the data you have here? What decisions will you make?
Mouse clicks
Your mouse clicks report may give you more mileage than your attention heatmap, although I’d question whether you’d need to go to the lengths of putting this tool onto your site to work out what should be clickable and what shouldn’t.
For example, I’m not going to start putting links on my first paragraph because people were randomly clicking around and I guess I probably knew that people would want to click on the images to enlarge them.
Again, you probably want to think about what you want to use this report for first, before you spend a lot of time on it. It’s useful to know what links people are clicking on in the navigation for a particular page, but your average web analytics tool can tell you this information. Most of them even have a nice tool that you can show the overlay as well.
Mouse Movements
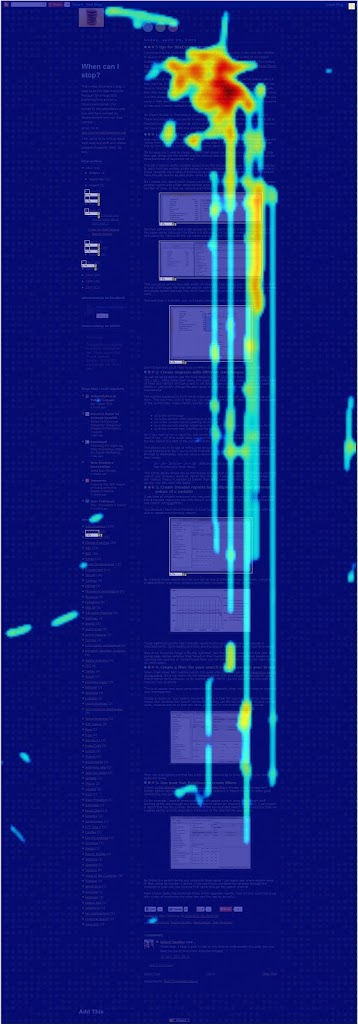
Mouse movements are a good proxy for eye movements (I suppose you could make the same argument about mouse clicks as well), so this is a good proxy for what the user is looking at.
The downside being on a scroll heavy page like the one that I am exampling is that there are a series of lines as the users have scrolled down the page, which kind of ruins this report.
Remember though that this report is a proxy for what people are looking at. Eye tracking technology will give you what people are actually looking at.
All four of these reports should be used in conjunction with each other to help build a profile of how users are viewing your pages to help you make changes. You can then use your analytics solution to monitor the effect on your KPIs.
Recordings
The other thing that you can do is see recordings of what users did on the site, which obviously doesn’t look that good on a screen grab, so I’m not going to show you it in action. Sorry.
This is literally what it says on the box, with the downside that it is very difficult to analyse the data. Why? Because looking at individual data is what scientists would call ‘anecdotal’ rather than scientific, so you need to look at large quantities of what people are doing.
But you can use the information that you’ve garnered from the reports above to get some information on what you should be looking for. And the bonus is that you can filter your data in some way. So you can find out why people aren’t scrolling or why they are scrolling or if they came from a certain website.
Form Analytics
I’m not going to spend too long talking about form analytics because I don’t have any forms on my site, so I haven’t used it.
What I will say is that there are other tools that you can put into your web analytics tool that will do the same thing (
here are some details about the SiteCatalyst plugin and we’ve implemented something similar for WebTrends). These tools work by sending calls to the server as the user navigates through the form.
ClickTale will probably give you more information because of the live nature of it (eg how long users stay on each form field).
Again, think about what information you want to get about the form – knowing how long users spending on a field doesn’t necesarily give you the insight to know what is wrong. You may get more value from finding out what errors that users are getting from incorrectly filling out the form than how long they spend on it.
Premium version
The free version of ClickTale gives you information about one page and a limited number of impressions. The premium version will give you more information. I recommend testing it on one page before moving on to a premium version to see what value you are getting out of it.
And remember – this tool more than anything else should follow
the 90/10 rule. You definitely need people on the floor to analyse the data and combine it with other data sources.


Leave a Reply