5 tips for SiteCatalyst Report Builder
I promise that the posts about SiteCatalyst detail are going to stop in the next few months in favour of more online featured posts, but today I thought I’d do a little bit on Report builder. For those of you who weren’t aware, Report Builder was actually a HBX tool before the ‘merger’ with Omniture. Previously Omniture customers were used to using Excel Client, which isn’t quite in the same class as Report Builder.
Excel Client is one of those oddities – almost all SiteCatalyst people will be able to use it if they want to. It is, however, slightly outmoded because of the dashboard features that you have in SiteCatalyst that you didn’t in HBX. SiteCatalyst itself has much more functionality than HBX does (or did – is there anyone still left on it?), so Excel Client, as I wrote last time, is a little disappointing. With Report Builder you always felt that you could do more than you could in HBX and it was more malleable; With Excel Client you could do just about the same or less and it wasn’t malleable at all.
So Report Builder in SiteCatalyst should be brilliant, should it not? Well it is and it isn’t. There are things that you can do in report builder that you’d never have been able to do in SiteCatalyst because you can do all the stuff that you can do in Excel alongside it, plus you can have multiple requests in a worksheet. Here are my top tips:
1. Create a Lookup from one report to another
How many times have you created two reports in Excel and then used a VLookup to get the values from one into the other report? Far too often? This is where Report Builder comes into its own, because you can use your second report as a lookup from the first one.
So for example I want to create a report that shows my site sections and how many visits they get, along with the entries and the bounce rate. Simple? Not on your nelly, unless you have hundreds of segments set up.
I’ve set a custom traffic variable (prop) to be the site section though, so I can get visits for it, but I can’t get entries, single access or exits because I don’t have pathing enabled (and those variables don’t mean the same thing when it comes to props anyway). I do however have the site section as part of the name of each page.
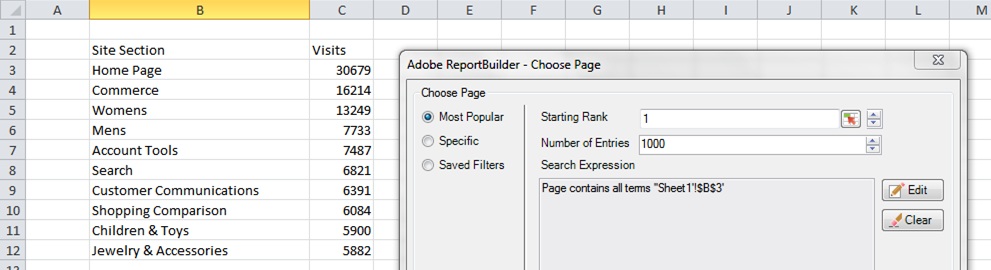
So I create one report which shows me the top 10 site sections and the visits. I then create another report with a filter attached that looks for the first value as such, with a large number of rows, so that we capture everything.

We then add in entries and single access as metrics and choose a custom layout. We hide the page names (although the filters will still apply, we just don’t want them on the page) and make the metrics be the sub totals and apply them to the next two fields.
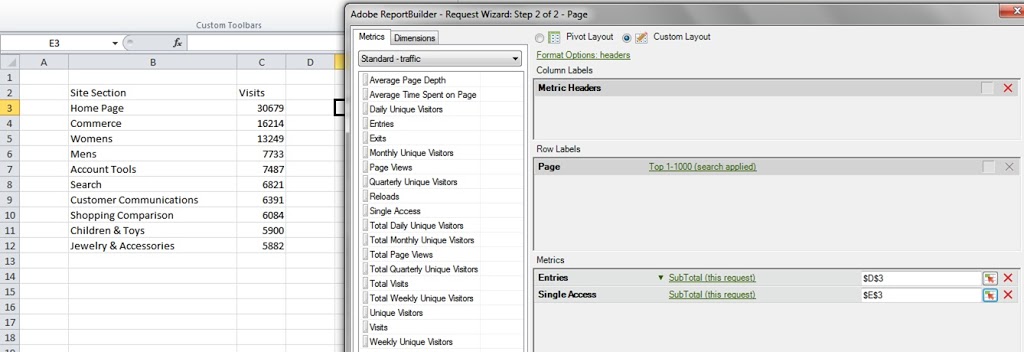
This now gives us two new cells which will show the total entries and single access for all of the top 1000 pages with that site section name in it (don’t forget that you can add up entries and single access because they don’t need to be deduplicated – they only occur once per visit).
The next step is a simple copy and paste (using the tool) for all of other sections:

Don’t forget that you’ll need to do a refresh of the requests to get the actual data!
2. Create requests with different date ranges
As well as being able to use the fixed dates (eg April 2012, 10th March – 14th March, Q1 2011, etc), rolling dates (last week, this week, last month, etc), preset dates (a combination of fixed and rolling!) and using cells to set date ranges (so that you can copy and paste as above or just simply change the date range on a whim), you can also use custom expressions.
The custom expressions don’t really make sense to start with until you start playing with them. The way they work is that you can choose a start and end date based on expressions of the current day, week, month, quarter, year.
- cd is the current day
- cw is the current week (starting on a Sunday)
- cm is the current month (starting on the first)
- cq is the current quarter (starting on the first of the quarter – Jan, Apr, July, Oct)
- cy is the current year (starting on the first)
cw – 1w – 3d to cw – 1w + 3d (effectively last Sunday minus three days to last Sunday plus three days)
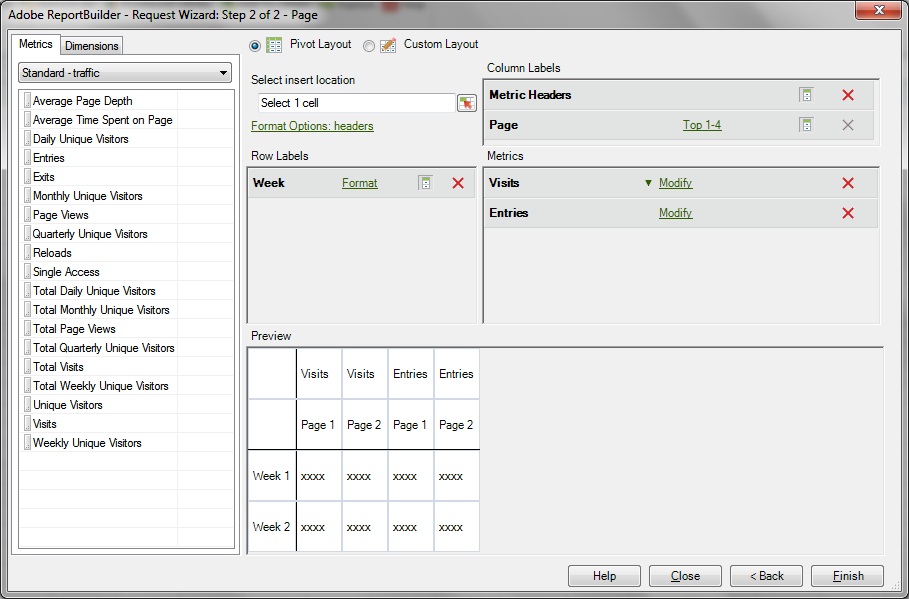
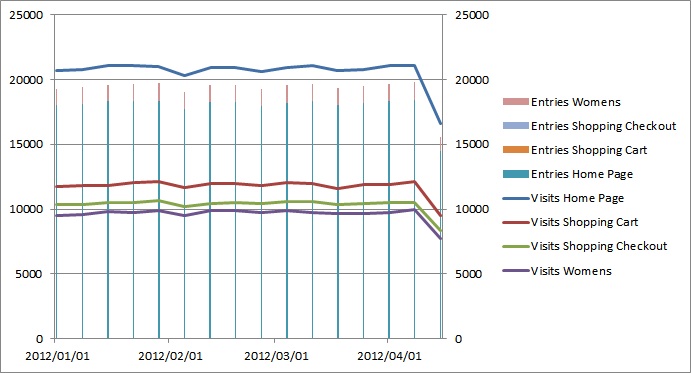
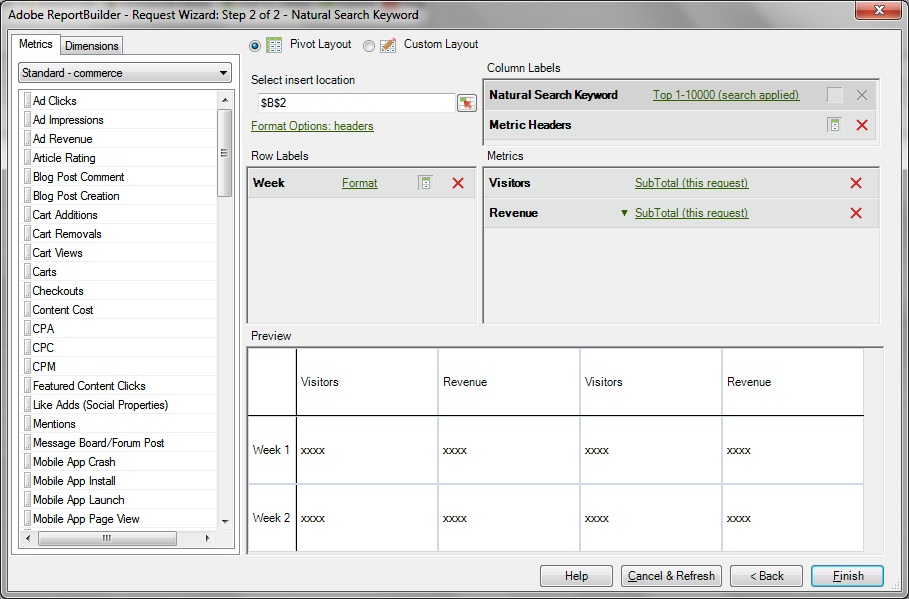
3. Create trended reports for multiple metrics and different values of a variable
4. Create a filter for your search terms to exclude your brand
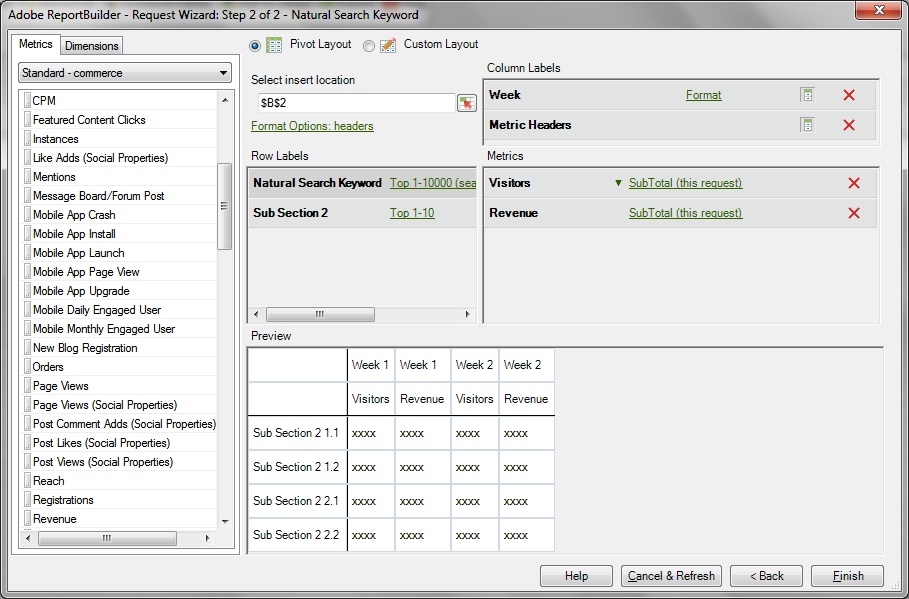
5. Use your Sub Relations to create filters
Great post. I have a post-it note on my desk to write exactly this post. But you beat me too it! Nice work. #mustworkfaster
Just stumbled across this blog Alec – great post and I hope you’re well!!
Thanks,
Cian