Web Analytics Wednesday With Alec!
Ok, I should have written this post last week (what is it that Kate said about scent when she guest blogged and I said about Persuasion Architecture?), but I have recently been presenting at Web Analytic Wednesday in London. For those of you not au fait with what this is, it is where a group of Analytics people get together in the downstairs of a pub and get drunk. Seriously, though, first of all we all stand around a screen whilst someone witters on about something that may or may not be relevant to everyone there for about half an hour and then afterwards everyone has a drink and networks. On previous occasions I’ve been more keen on doing some of the networking than listening to the presentations because they can seem a bit like a sales pitch. Bob (who does an excellent job of organising) has tried to curtail this in the past to encourage people to speak on topics around their company, rather than directly on it.
However this month’s version was very much different. Why? Because you had me speaking at the presentation and I don’t sell anything. Look around to the sides of this blog. I really should start selling things, then I might be able to retire early and spend all my time giving away analytics advice for free. Hang on, I get paid for that at the moment. Anyway, my presentation was a bit different. Because I work for a government organisation, it means I can give away some of the analysis that I did internally to outside people because it won’t help any competitors. We don’t have any competitors. More than that, I could do it with real figures, rather than using the percentages, plus I could push it at a real topic, rather than one manufactured to sell my product. (PS thanks to Miles at Targetstone and Lawrence at Digital Analytics Review for their kind words).
This was actually a presentation that I’d done previously (twice at least) internally to the owners of a section of the site. We were trying to work out what we should be doing to get more people looking at the section. Rather than recreate that presentation here, I thought I would post what the analysis was, why I did it (how to recreate it) and what some of the recommendations were.
Why did you do the presentation?

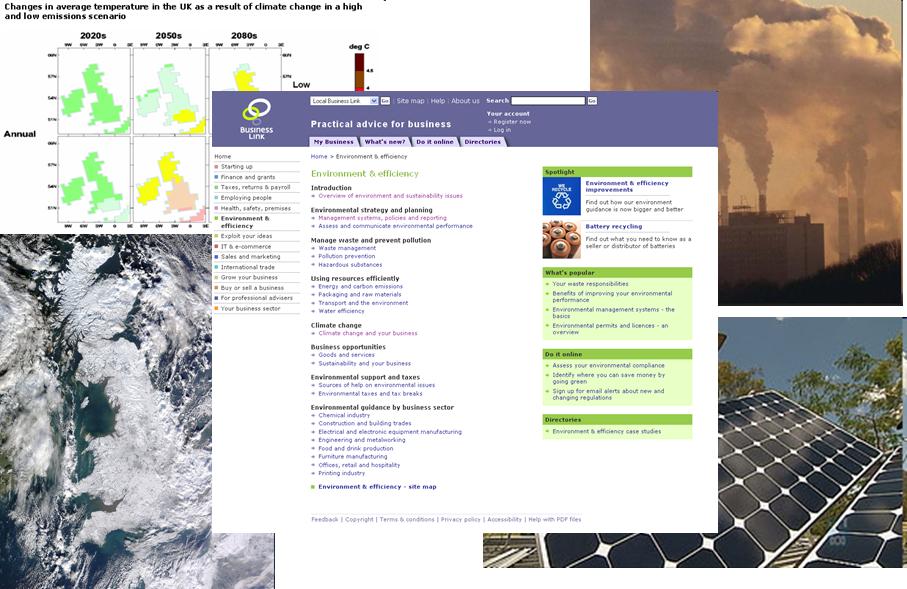
The website has two real issues. One of them is that it needs to tell you what you should do to comply with the law. These are the regulations that you have to make sure that you do everything within your capability to comply with. Some insist that you pay tax to the Government in a certain way, some say that if you don’t do it then you’ll be fined. That about sums it up.
The other side of the coin is that just telling you to do things isn’t that helpful, so you really need advice on how to do it. Even if that means some advice on how to fill in your tax forms or other relations that you have to comply with.
Obviously for the regulations, if you need to know, you need to come to the site (or find it elsewhere, but mainly you’ll need it so you’ll have to come). For the advice parts of the site, you may not know that you need the advice or how to use it. More importantly there are plenty of people out there who are willing to make you pay for it.
One of the challenges we face is how do we promote the advice sections, get more people looking at it and then prove their worth. This presentation was really looking at the how people interact with the section in the first place and helped waver some misconceptions and give us a bit of guidance on where our priorities lay.
What did you analyse?
Whilst I am going to point out here and now that the site is a government site, it doesn’t run for profit, but it still has all the same principles as an eCommerce site. You can still measure the success of your site, but you have to do it in a slightly different way.
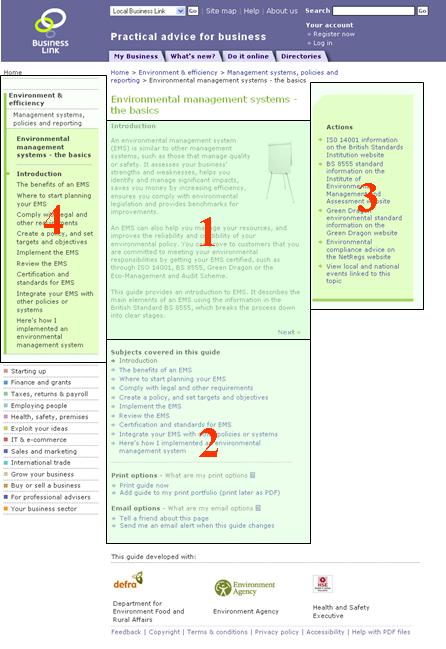
So what did I do. I think the first thing that you always need to do is break down your site traffic over time into the sections it sits at on the site (or the types of content, or however you like to break up your site). There is nothing worse than looking at the very top level and then the bottom. You need to work down layer by layer (like an onion). Personally I always like (if I can) splitting those layers up into finding out not only how many visits to each of them there were, but also how many entered the site at a point in that section as well. With this information it became fairly obvious for my section, 80% of the visits who viewed it also arrived at the site at it.

This means in the case of our site, the section in case was broken up into topic areas. This was meant to be a convenient way of grouping the content together for the users, but it has an added side effect that it was useful for me to work out what the users were looking at. You can do this really easily in most analytics tools, but it is often widely missed when coming to the actual reporting. If you are using Omniture, use your hierarchy reports (we collect the breadcrumb trail in ours). In Google Analytics it is set up to work based on the structure of the url (but if you look at the structure of this url, then you’ll see it is a bit rubbish – you can work on that and customise it very easily to other parameters). It appears in your Content drill down report. It’s vitally useful so make sure you look at it.

Next up, pick out your major navigation pages, do this using your pages report. Next you want to show how traffic is flowing to and from those pages as a whole. The easiest way of doing this is to put the number of visits on the page and the number of entries on the page. Now navigation pages work in two ways (predominantly, obviously there are shades of grey in the middle):
- Landing page – this page needs to be set up so that users who navigate to it from outside know what is going on and there is the related scent to allow users to be able to flow through the site. Work this out by looking at the referring domains/keywords
- Non-Landing page – most of the users in this case are already on the site when they get to it. This shouldn’t really be treated any differently, per se, but when building your scent you need to look at where users came from using your clickstream analysis instead of your referring domains/keywords
- Ensure that the content is grouped so that someone coming in from the bottom can find related content
- Make sure that the titles of the related content are descriptive irrespective of their higher navigation
- Make sure that the titles are scannable so that users are more likely to click on them
- Put more inline links in the content to get users navigating around
- Generate more visits from Government websites
- Generate more visits from commercial websites
- Work on building up a keyword footprint so that we can optimised the search traffic
- Get more links in the rest of the site from related content of high volume, high value sections to drive more internal traffic
Leave a Reply