The difference between Accuracy and Precision

I did a Google search earlier on mentions on my blog of the word accuracy and the precision. Neither appear at all. That was a little depressing, because I’m sure I’ve written about this before. But there you go. Anyway, I’ve been thinking of writing a post about statistical analysis for a while. I’m also wary that I am grossly underqualified to write a post on statistical analysis, which I why I’ve put it off for so long. Feel free to post up in the comments exactly where I’ve gone about this in the wrong fashion. Lets start with some Web Analytics basics.
Data out of Web Analytics systems is not accurate. They are set up, however to be precise. These are two completely different things that everyone should know about. I would suggest that you read the wikipedia article about it, but then you’d probably get side tracked and never come back to my blog.

To sum up in a short space – accuracy means you are closer to the true value, whereas precision means that your data points are not widely spread.
Why is this important? Web analytics is all about trending over time. You can find out how something it doing at the moment and you can get some insight into that – where people are coming from, where they are going to, etc. But really what you want to do is try changing something and seeing the impact that it has one your data.
So our nice little chart up there describing the difference between accuracy and precision, or indeed all the target views that you can get of the same data if you do a Google Image search, don’t really paint the full picture. What you need to think about is how this affects your graphs over time. You need to take that graph up there and turn that into a three dimensional time graph.
So I’ve done it with the visits to my blog. I’m going to assume that I have a precision of +/- 20% each way. That’s a lot, but I’ve done it to illustrate a point that you’ll see in a minute.
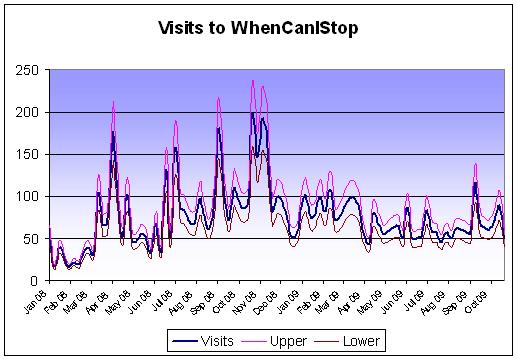
If you look at the upper and lower limits of what the real figure could be, you suddenly get a much better picture of what is going on. That period in between May 2009 and September 2009 represents a fairly flat time for the blog. Visits not going up or down a lot. Or where they? They could have been going up or down wildly. According to Google Analytics, in two consecutive weeks I had 50 and 51 visits. However with my 20% range on that, it could have swung anywhere from 40 to 60 in a week (or vice versa). That would represent an increase in visits, week on week of 50%, just from a small 20% error rate.
However if I’d had a precision of 5% over that time, the most it could have swung from would be 47 to 53, which represents a much smaller change. This is where precision comes in very useful. Knowing that if you completed the same experiment 50 different times and were only out by 5%, rather than 20% means you can forecast how your tool is doing.
Accuracy however is a completely different matter. Did I get 51 visits in that month or 23? How far out is that number? The answer to this question is that it doesn’t really matter how far out I am, as long as every time I measure it I get a precise result. Why? Because when I change something (as I did the next week by writing a new post) I can then measure how different this is to the previous one with confidence. Hey – you’d probably like it to be in the ball park, but as Johnny Longden said in that post I linked to up there: Cookies, javascript, people, etc all mean that you’re unlikely to have a very accurate picture.
This is all well and good assuming that your data has a normal distribution. That would mean that your figures were just as likely to be out by being up as they are being down. Normal distributions occur on things like height, length of foot, that sort of thing – where everything is kind of quite high in the first place.
Do web analytics data fall under a normal distribution model?
I some how doubt that they do. There is a law in economics called the law of diminishing returns (excuse all the wikipedia links). The law states that the more you have of something, the less likely you are to make additional unit profits out of it because of a degree of corruption that you end up with. I think this rule probably holds true with analytics systems as well, but possibly with different consequences.
- Normal distributions can’t hold because of the lower limit ie you can’t go below zero (and yes I know you can’t go below zero for your height either, but that is different because the median is high for the height and the precision means that zero height is highly unusual – that’s not the case for web analytics systems that frequently report zero visits)
- Poisson distributions of the data may be a good approximation and we know the larger the number the more likely it is to follow a normal distribution. The graph below shows a couple of poisson distributions for increasing Lambda (ie the number you were expecting).
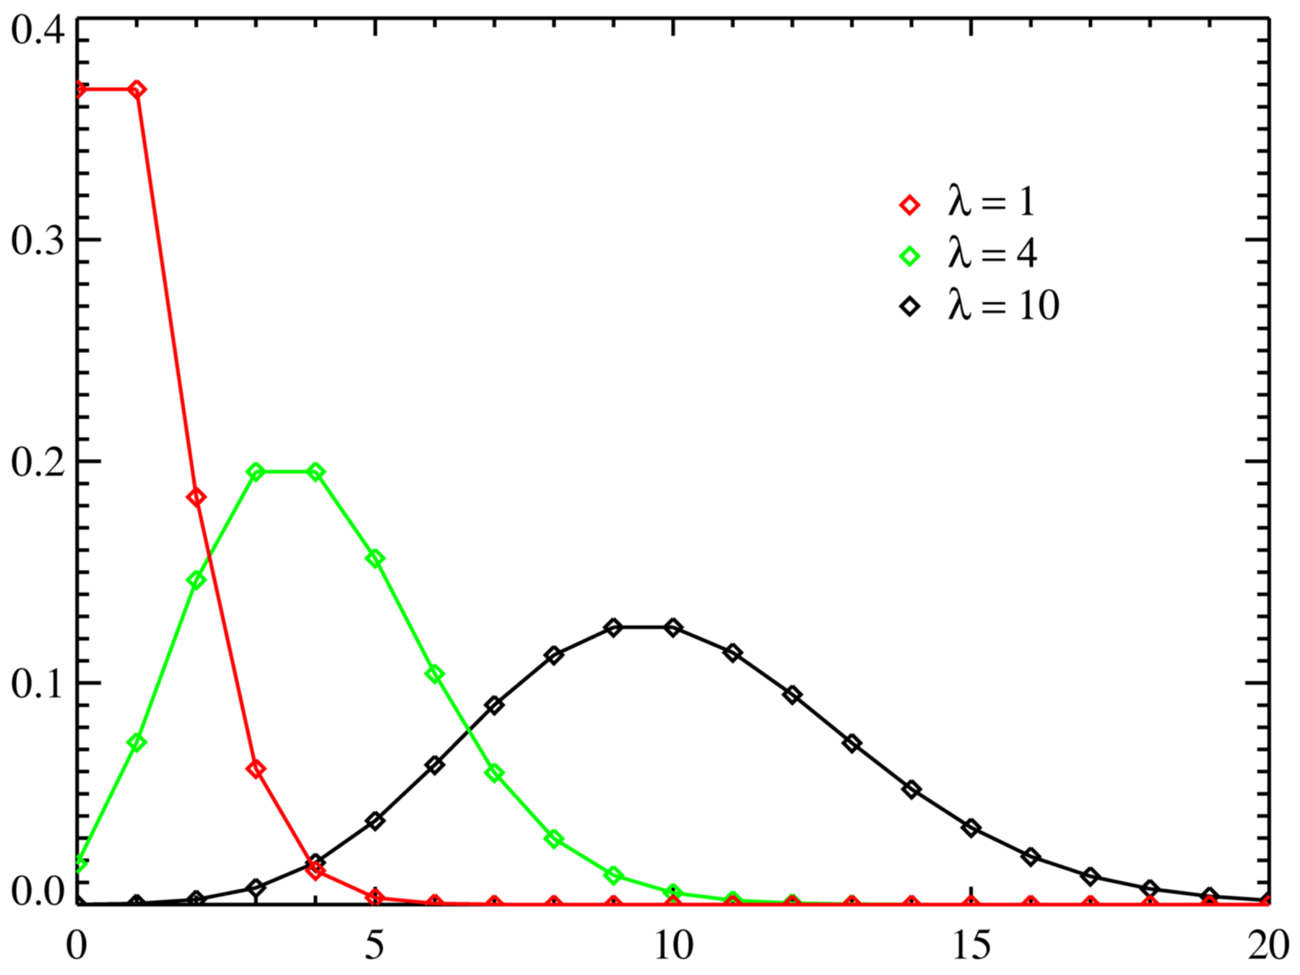
That would mean that for low figures you are expecting small differences, but they will be significant in terms of percentages, but for larger figures there is more likely to be a larger error margin and hence the figures may not be so precise. This is certainly true for any analytics tool that uses sampling to increase its efficiency (as Google Analytics does) or indeed any tool that limits its table lengths (as HBX does – or did). However other tools that don’t do this can frequently end up with data processing issues that may or may not cause a lag because of the large quantities being produced.
So how do we work this out then? Is there a hard and fast rule? Well for one I won’t be worrying about the accuracy of my figures. Do I have 50 or do I have 32? It doesn’t matter. When I go from 50 to 51 though, I want to know that this is one additional visit, or whatever in that time period. Do I know that? I wonder whether any analytics tool would ever like to say how precise they think their tool is. I wonder if they know or could know. Bar asking 100 random people to view a page on a daily basis for a couple of months. And then they’d have to retry it with 10 people and 1,000 people as well just to make sure that their accuracy doesn’t change with larger samples.
This is probably the perfect project for a student to do as a thesis, actually. Any takers?
Leave a Reply