Web Analytics for Content editors
Recently (ok, it seems like it was recently, but actually it was almost a month ago now – where does time go) I was reading a post on the web analytics forum about training in Web Analytics for editors. It was interesting as it was coming in at a time in my current job where I was thinking about that again, having done it in my previous job working at a B2B news organisation. Whereas now the copy isn’t news, but is very long lasting and needs to be changed/updated, whereas there is also new copy coming on all the time. So I dug out an old presentation that I’d been given and started to write this blog. The question is, what do content editors need to be looking at in Web Analytics data to help them do their job?
Just to be clear about this – Content editors should be interested in how they affect the company’s bottom line. For my previous job this was maximising their profit through whichever business model they were going for. For my current job there are a whole host of things, but because the website is not for profit, they can be a very specific group of success events. Needless to say, for both the web analytics data is of vital importance in terms of calculating revenue and whilst publishers and editors have long be looking at page views (as a proxy for ad views) to show how much money their content is making, maybe they aren’t aware of how they can use the data to improve the site.
1. Every Content Editor should know what a page view, visit and (unique) visitor are.
The Web Analytics Association defined these over a year ago. I’ve got my own simplified and not technically correct versions – but this is how they should be understood:
- Page View – A page loaded by a person
- Visit – A session of looking at a website/page by a person
- Visitor – A person looking at a website
Actually it’s not even that simple. That is how it should be. This is what we really count if you use javascript tags and cookies:
- Page View – A page with a tag being loaded
- Visit – A series of page views by a unique user until 30 minutes of inactivity
- Visitor – cookie
Now I’m not going to go into the whole cookie debate. What I do tend to tell people is that Visitor data sucks. Yes that’s right. It’s fairly useless. It’s the most inaccurate thing you could ever imagine (people deleting cookies, using more than one computer, etc, etc). Don’t use it. Use page views and visits. They don’t suck. They’re fairly accurate. Bravo!!!
Well actually when it comes to page views, you have the problem for a page that sometimes someone will click on a link on that page and then come back to it later, so you might get more than one page view for the same page in a visit. You don’t want to count all of them, because you’re only really interested in the fact they saw it in a visit, not how many times they saw it. So lets use visits instead. That way if you view a page once or more in a visit, lets include it only once. Huzzah – visits rule the waves. Before anyone comments – having multiple views of the same page if you sell advertising on that page is good (you have more advertising to sell after all), but in terms of a content editor – you just want to know that the person has viewed the page.
2. Know what Entries, Exits, Single Access and Bounces are
These are very hard to write about without giving a real description to your journey, so I like to do it in that way. When you’re browsing through the web you end up on a website at a specific page (either by clicking on a link, typing in the url, or having bookmarked the page). That page won’t necessarily be the home page, but it will be your entry page.
When you leave the website, the last page you loaded is now your exit page. This is the point where you’ve said “Ah, I’m bored, I’m going to look elsewhere!!” or “Brilliant, I’ve done what I want, I’m out of here!” or “Damn, who is that at the door, I’d better go and answer it, oh its uncle David just nipping in for a cup of tea and why haven’t I finished ironing my shirts, I better just nip away from the computer.”
What happens if you arrive at a website and leave without viewing any other pages? This is what your single access pages are. These are people who bounce on and off your website. You can claim your bounce rate is the percentage of the people who arrived at that page, who leave without viewing another page. Note that you could view the same page repeatedly before leaving and still be a bounce. This means you need to be wary when setting up your analytics tools if pages are going to have the same page name (Omniture/HBX/others) or the same url (Google Analytics/others).
3. Work out how you’ve set up your content groups
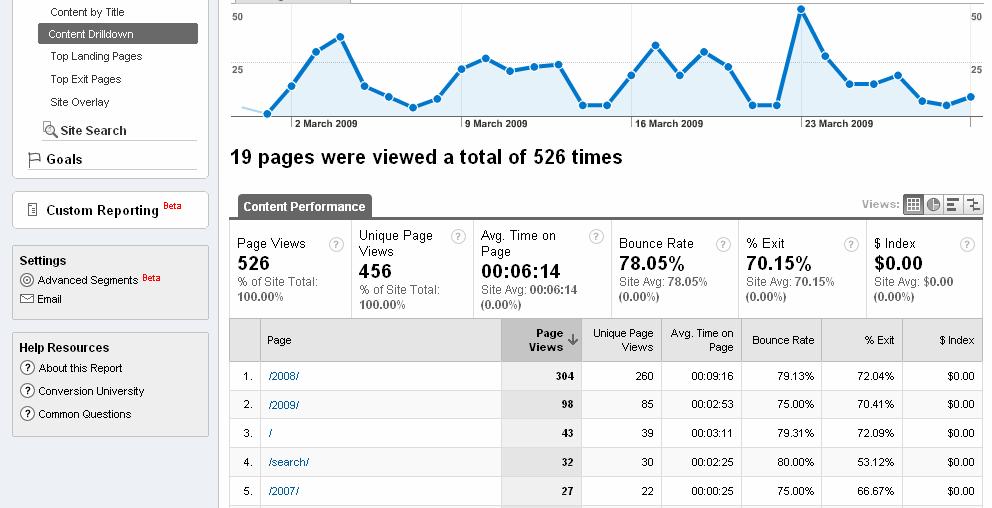
Every web analytics tool makes use of them. In Google Analytics, you go to the content breakdown:

Here you can see your page views and unique page views (make them into visits properly and then call them visits dammit. Do you here me Google?!?!?).
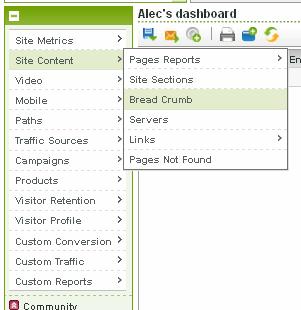
In SiteCatalyst there are other ways of doing this and it will be specific to your set up. For our site we make use of the breadcrumb trail that describes the levels of navigation on our site (and I think that is far more useful than the breakdown of the url as above).
Remember that when you get to these reports, you can drill down level by level, to give you deeper insight into the visits to each of the sections, as well as giving you ‘top level’ data.
4. Drill down to individual pages
Now really this is where editors earn their crust. The above was just proving that they could measure the long tail (use the above content groups along with the top 10 visited pages to show that you have a long tail. You do have one – I’m certain of it). What we really want to do is look at the pages themselves and see what they are doing. Firstly we need to think about metrics.
- Visits to a page are important – you want to know how many times it was visited
- Entries to the page are important – you want to know how many times it was the first page a person saw
- Single Access visits are important – you want to know how many times the first page was the only page and you didn’t cause a user to delve deeper into the site.
This brings up two new metrics:
- Entry rate – percentage of a page’s visits that were caused by the user arriving directly at that page
- Bounce rate – percentage of entries that left without viewing another page on the site
Clearly a page with a high entry rate has a reason for having a high entry rate. What was it? Where did the visits come from? And if they have a high bounce rate, why did that happen? What can you do to decrease it and encourage your users to continue on in the site?
This all brings me on to the next topic, which I’m going to save for another blog post (this one is too long already). How do you put all these metrics above into a method of increasing the visits to your site? This is really the crux of it – the above is just giving you a foundation on how to work this out.
Leave a Reply